Master of Science Physician Assistant
The following statistics from the 2020 Application Cycle are intended to provide applicants with an indication of how they compare to the successful applicants.
2020 Application Counts
Verified CASPA Applications: 281
Interviews Granted: 60
Students Enrolled: 29
Enrolled Student Data (Average)
Cumulative GPA: 3.35
Overall Science GPA: 3.29
PA Shadowing hours: 152
Patient Care hours: 4,148
Volunteer/Community Service hours: 835
Age at time of Application: 25.8
Gender
- 73% Female
- 27% Male
Other Demographics
Students with Advanced Degrees: 1 PhD
Students with Military Experience: 0
Student Demographic Graphs
Students by Region
- Tri-County: 7 students
- Other CA: 16 students
- Other West: 2 students
- Other US: 4 students
Students by Race & Ethnicity
- White (non-Hispanic): 30%
- Hispanic/Latino: 30%
- Asian: 36%
- Black/African American: 3%
- Pacific Islander: 3%
Total exceeds 100% due to applicants selecting multiple categories.
The following statistics from the 2019 Application Cycle are intended to provide applicants with an indication of how they compare to the successful applicants.
2019 Application Counts
Verified CASPA Applications: 543
Interviews Granted: 100
Student Enrolled: 33
Enrolled Student Data (Average)
Cumulative GPA: 3.40
Overall Science GPA: 3.32
PA Shadowing: 179 hours
Patient Care: 4,191 hours
Volunteer/Community Service: 733 hours
Age at time of Application: 26.4
Gender
- 70% Female
- 30% Male
Other Demographics
Students with Master's Degrees: 3
Students with Military Experience: 0
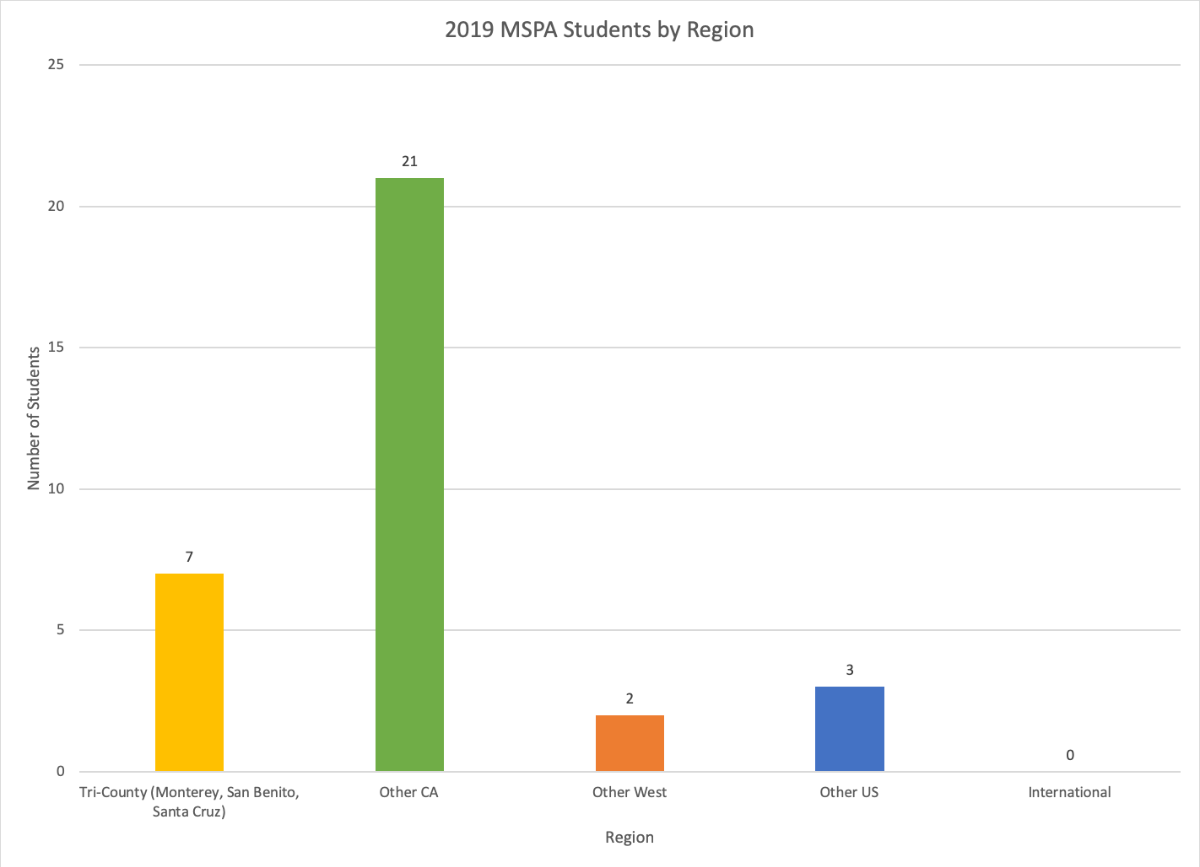
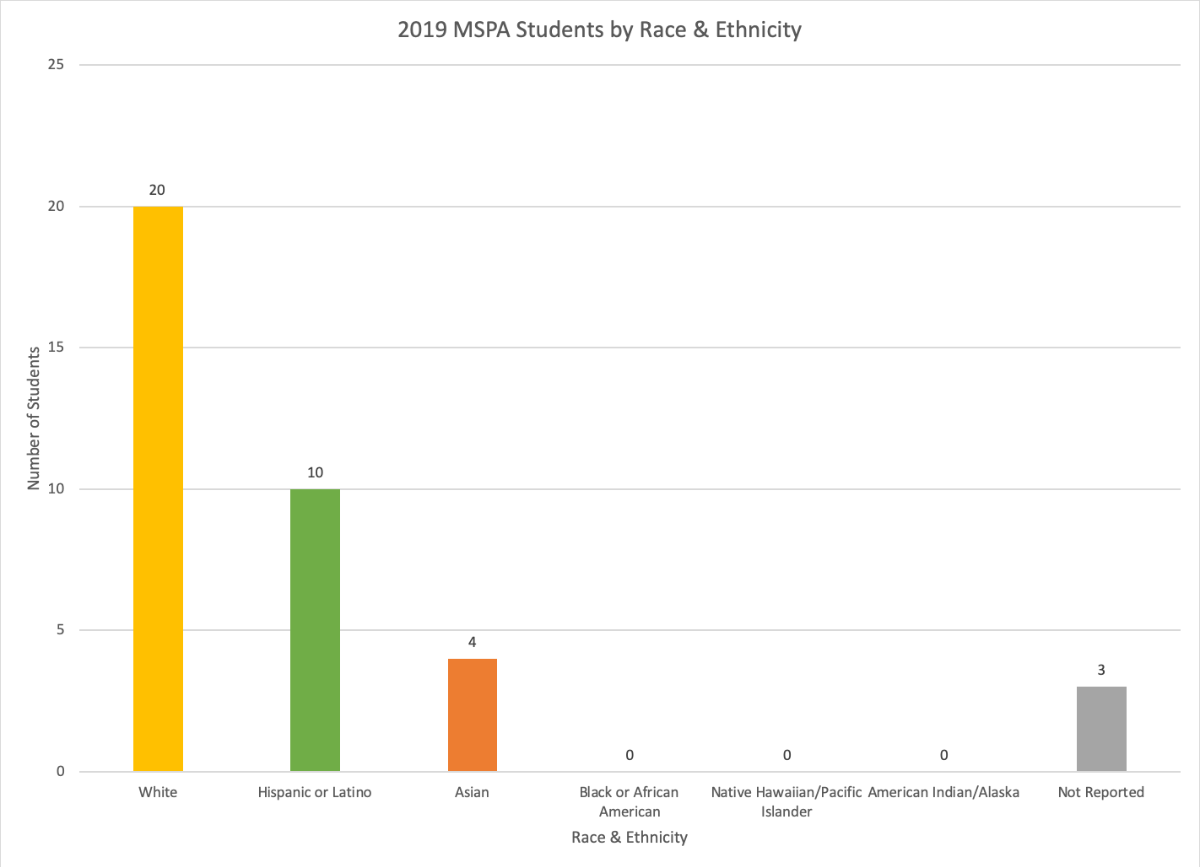
Student Demographic Graphs
Students by Region

- Tri-County: 7 students
- Other CA: 21 students
- Other West: 2 students
- Other US: 3 students
Students by Race & Ethnicity

- White: 20 students
- Hispanic/Latino: 10 students
- Asian: 4 students
- Black/African American: 1 student
- Not reported: 2 students
Total exceeds 100% due to applicants selecting multiple categories.
The following statistics from the 2018 Application Cycle are intended to provide applicants with an indication of how they compare to the applicant pool. The program was granted Accreditation-Provisional by the ARC-PA in July 2018, and application numbers are expected to increase with each upcoming application cycle.
2018 Application Counts
Verified CASPA Applications: 477
Interviews Granted: 97
Students Enrolled: 32
Enrolled Student Data (Averages)
Cumulative GPA: 3.34
Overall Science GPA: 3.29
PA Shadowing: 153 hours
Patient Care: 5,724 hours
Volunteer/Community Service: 1,384 hours
Age At Time of Application: 26.7
Gender
- 65.6% Female
- 34.4% Male
Other Demographics
Students with Master's Degrees: 3
Students with Military Experience: 1
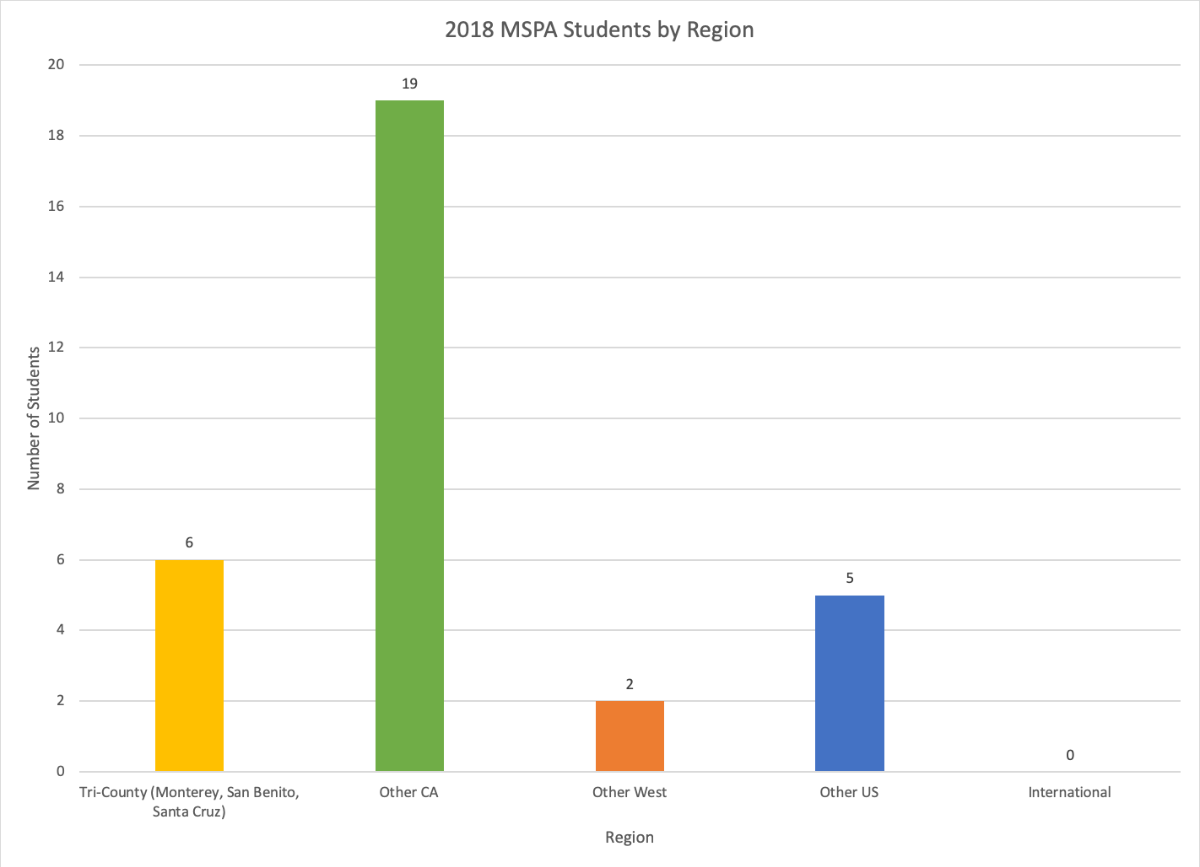
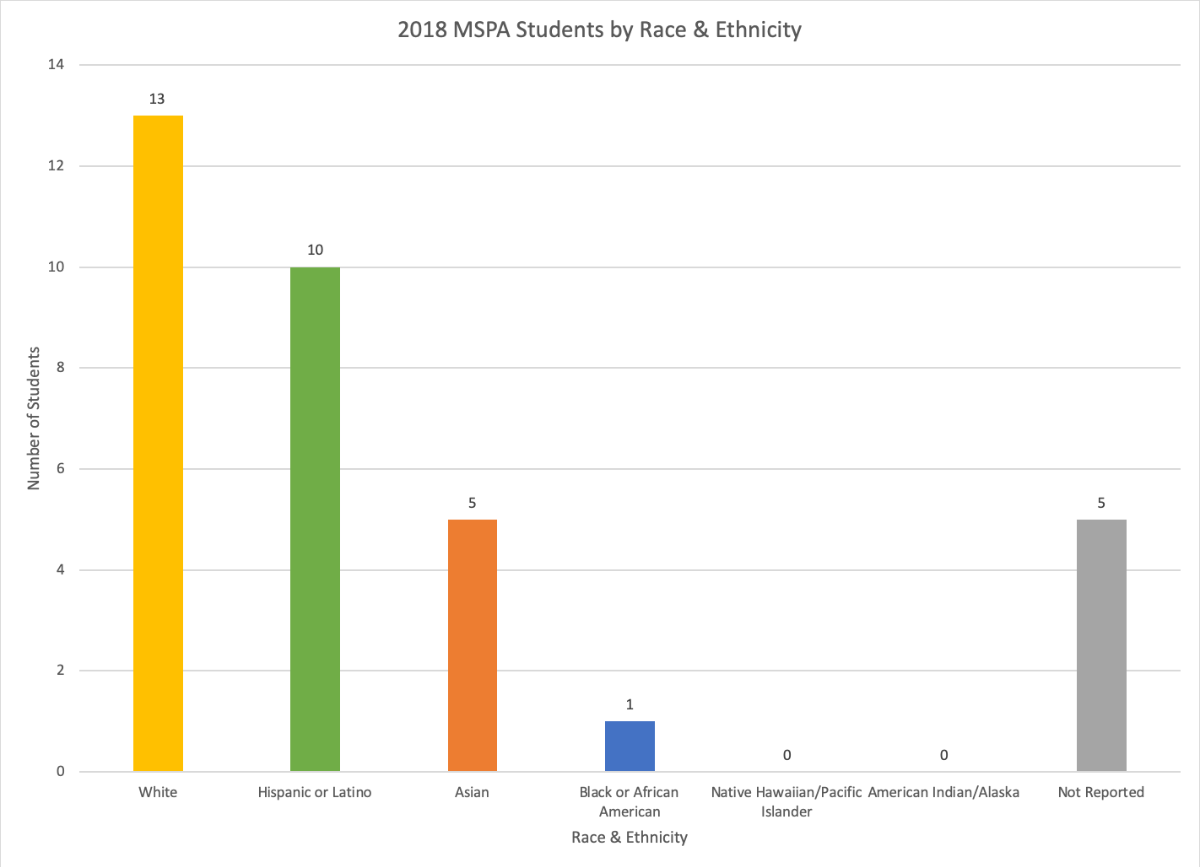
Student Demographic Graphs
Students by Region

- Tri-County: 6 students
- Other CA: 19 students
- Other West: 2 students
- Other US: 5 students
Students by Race & Ethnicity

- White: 13 students
- Hispanic/Latino: 10 students
- Asian: 5 students
- Black/African American: 1 student
- Not reported: 5 students
Total exceeds 100% due to applicants selecting multiple categories.