
In this issue:
Exploring Average Course Unit Loads and Full Time Equivalent (FTE) Enrollment Trends of State-Supported, CA Resident, Degree-Seeking Undergraduates
- Why explore average course unit loads and FTE enrollments?
- What are the recent trends in the average course unit loads and FTE enrollments for state-supported, CA resident, degree-seeking undergraduates?
- What are reasons students may not take 15 units?
- What do these trends mean for CSU Monterey Bay and our students?
- How do CSU Monterey Bay trends in enrollment compare with the CSU overall and national trends?
Why explore average course unit loads and FTE enrollments?
On November 30, 2022, President Vanya Quiñones outlined “One Strong Future” for CSU Monterey Bay in the State of the University address. As one of several opportunities for CSU Monterey Bay, President Quiñones stated we will: “Strengthen our focus on enrollment goals.” Revamping student enrollment goals university-wide includes plans to increase retention and enrollment as well as increasing the average unit course load per student.
Course unit loads of students are an important factor in the calculation of Full Time Equivalent (FTE) enrollment, and FTE enrollment is used for determining the distribution of State funding allocations throughout the CSU. One FTE is equal to 15 course units enrolled for all types of students except graduate students, whereas one FTE is equal to 12 course units enrolled for graduate students. Thus, a full unit load is 15 course units enrolled for undergraduates and other non-graduate students; 12 course units enrolled is a full unit load for graduate students. This definition of full unit load differs from other ranges for full-time and part-time status such as those used in determining financial aid eligibility and tuition fees.
This issue of IAR Insights aims to explore the average course unit load and FTE enrollment trends of our state-supported, CA resident, degree-seeking undergraduate students between academic years 2018-2019 and 2022-2023. Breakdowns of these trends by Admission Basis Group, Student Level, Region, First Generation status, Received Pell Aid status, Underrepresented Minority (URM), and enrollment in support programs are visualized. In addition, student responses for why they may not take 15 units are also provided. Finally, some implications of the declining trends in average course unit loads and FTE enrollment are mentioned and additional resources are provided to explore enrollment trends in greater detail.
What are the recent trends in the average course unit loads and FTE enrollments for state-supported, CA resident, degree-seeking undergraduates?
Across most of the demographic groups, average unit loads declined beginning in the 2019 Fall semester. In 2019 Fall, curricular changes were made to general education courses with many courses decreasing from 4 units to 3 units in compliance with Executive Order (EO) 1100. After these changes went into effect, students took a similar number of courses as before the EO 1100 policy changes, but their average unit loads were less due to the decrease in the units associated with those courses. For example, in the 2018-2019 academic year, First-Time Freshmen took on average 9 courses across the fall and spring terms and took 9.8, 9.7, 9.6, and 9.6 courses on average in the fall and spring terms of academic years 2019-2020, 2020-2021, 2021-2022, and 2022-2023, respectively. Upper Division Transfers took on average 8.3 courses across the fall and spring terms in the 2018-2019 academic year and took on average 8.9, 8.9, 8.8, and 8.8 courses on average across the fall and spring terms in academic years 2019-2020, 2020-2021, 2021-2022, and 2022-2023, respectively.
Student Level and Admission Basis Group
- Students that entered as First-Time Freshmen (FTF) across all student levels have had decreases in their average unit loads in recent terms. Those at the junior level tended to have average unit loads closer to a full unit load (15 units) than those at other levels. Seniors have consistently had the lowest average unit loads.
- FTE declines for students that entered as FTF have been most pronounced at the Freshman student level as smaller FTF cohorts entered up until 2022 Fall, when a larger new FTF cohort enrolled. Across the other student levels, the lowest FTE enrollment for each level has been within the last academic year (2022 Fall and 2023 Spring).
- Students that entered as Upper Division Transfers (UDTs) have had average unit loads that are consistently at least one unit below a full unit load (15 units) across all of the terms, and these have been declining over time.
- UDT FTE declines have occurred after the 2021 Fall term.
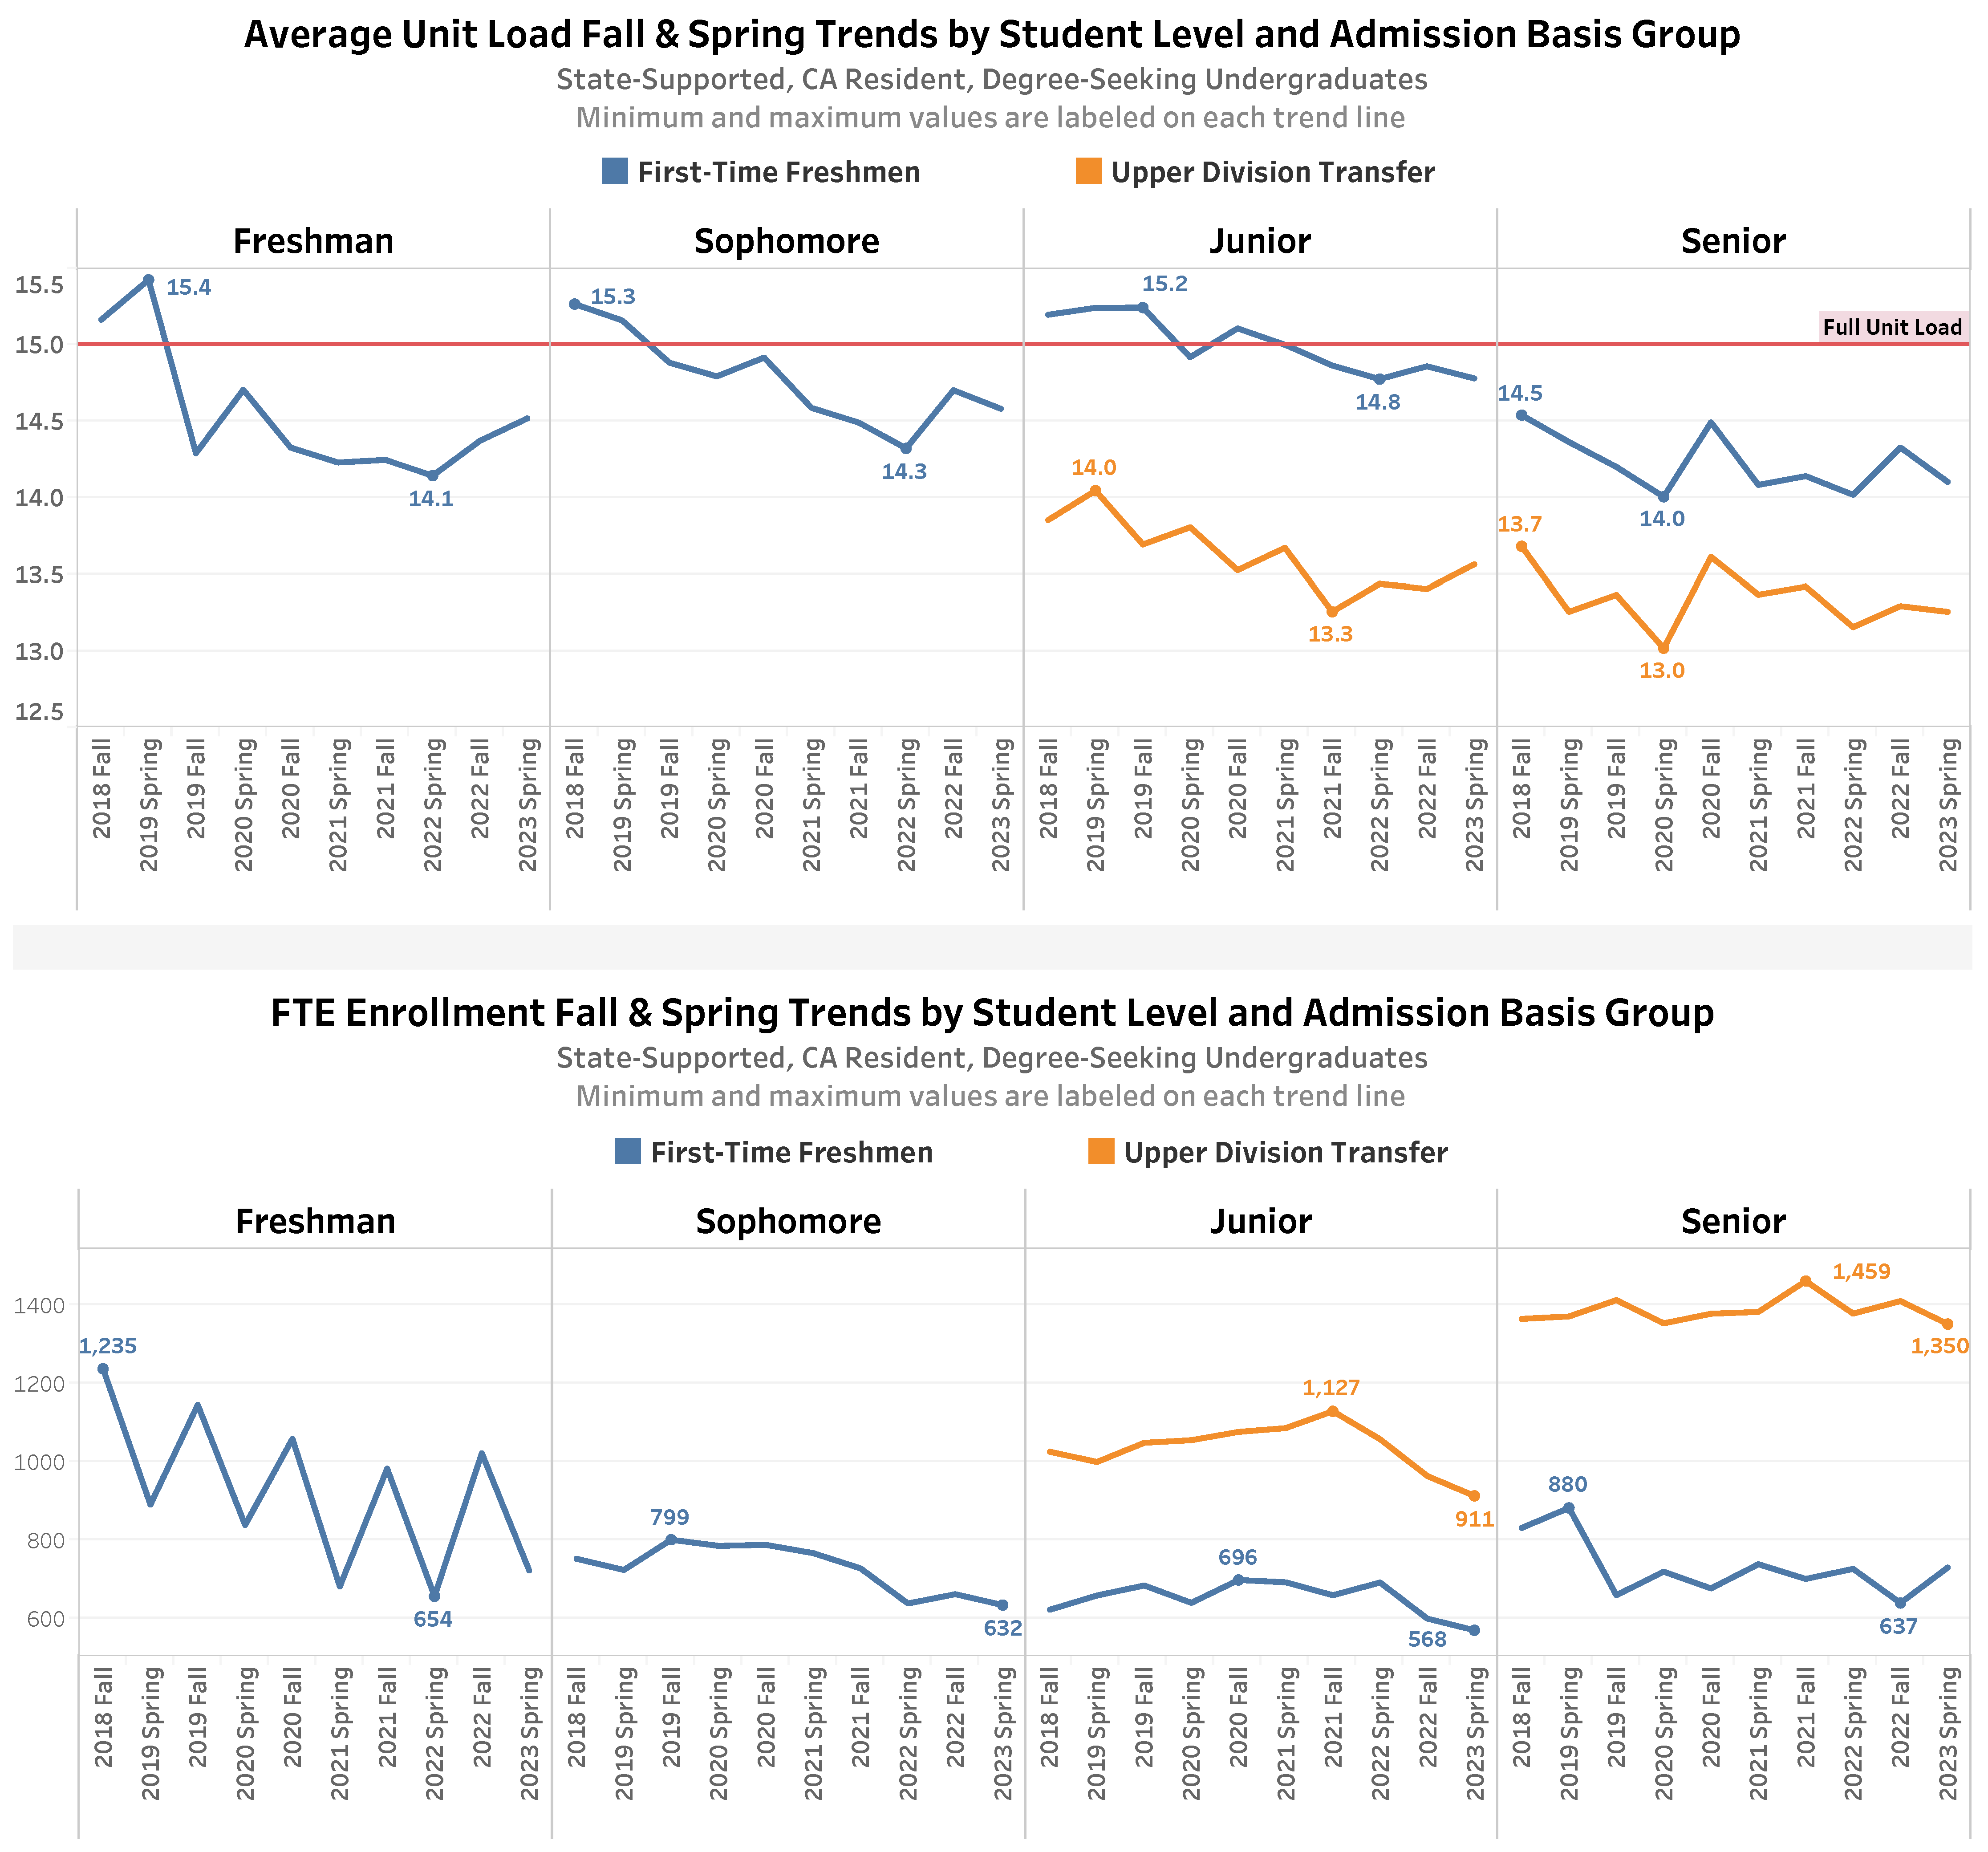
Note: 2023 Spring data points are preliminary (pre-census) and subject to change. “Lower Division Transfer” and “Transitory” Admission Basis Group groupings are not shown because of small numbers. A small number of “Upper Division Transfers” with “Sophomore” Student Level are also not shown.
Data Source: CSUMB Data Warehouse
Average Unit Load and Full Time Equivalent (FTE) Enrollment Fall & Spring Trends by Student Level and Admission Basis Group
Student Level
Admission Basis Group
Metric
2018 Fall
2019 Spring
2019 Fall
2020 Spring
2020 Fall
2021 Spring
2021 Fall
2022 Spring
2022 Fall
2023 Spring
Freshman
First-Time Freshmen
Average Unit Load
15.2
15.4
14.3
14.7
14.3
14.2
14.2
14.1
14.4
14.5
Freshman
First-Time Freshmen
FTE Enrollment
1,235
889
1,143
836
1,057
679
980
654
1,020
720
Sophomore
First-Time Freshmen
Average Unit Load
15.3
15.2
14.9
14.8
14.9
14.6
14.5
14.3
14.7
14.6
Sophomore
First-Time Freshmen
FTE Enrollment
750
722
799
783
786
764
726
636
660
632
Junior
First-Time Freshmen
Average Unit Load
15.2
15.2
15.2
14.9
15.1
15.0
14.9
14.8
14.9
14.8
Junior
First-Time Freshmen
FTE Enrollment
620
656
682
638
696
690
657
690
597
568
Junior
Upper Division Transfer
Average Unit Load
13.9
14.0
13.7
13.8
13.5
13.7
13.3
13.4
13.4
13.6
Junior
Upper Division Transfer
FTE enrollment
1,023
997
1,046
1,053
1,074
1,084
1,127
1,056
962
911
Senior
First-Time Freshmen
Average Unit Load
14.5
14.4
14.2
14.0
14.5
14.1
14.1
14.0
14.3
14.1
Senior
First-Time Freshmen
FTE Enrollment
829
880
657
717
674
736
699
724
637
728
Senior
Upper Division Transfer
Average Unit Load
13.7
13.3
13.4
13.0
13.6
13.4
13.4
13.2
13.3
13.3
Senior
Upper Division Transfer
FTE Enrollment
1,363
1,369
1,411
1,352
1,376
1,381
1,459
1,376
1,408
1,350
Region and Admission Basis Group
- Both FTF and UDT from the tri-county region have average unit loads that have trended lower than peers from other California regions.
- Average unit loads for UDTs are consistently lower than those of FTF, regardless of the California region, but there have been upticks in the average unit loads for UDTs from California regions other than the tri-county region since 2022 Spring.
- For FTF, FTE enrollment declines are observed since 2018 Fall for those from southern California and since 2019 for those from the tri-county region.
- For UDT, FTE enrollment declines have occurred across all of the regions in recent years but there is a pronounced dip for those from the tri-county region after 2021 Fall.
- A greater share of UDT FTE enrollments have been from the tri-county region, so their lower relative average unit loads play a contributing role in decreasing FTE enrollments for UDTs from the tri-county region since 2021 Fall.
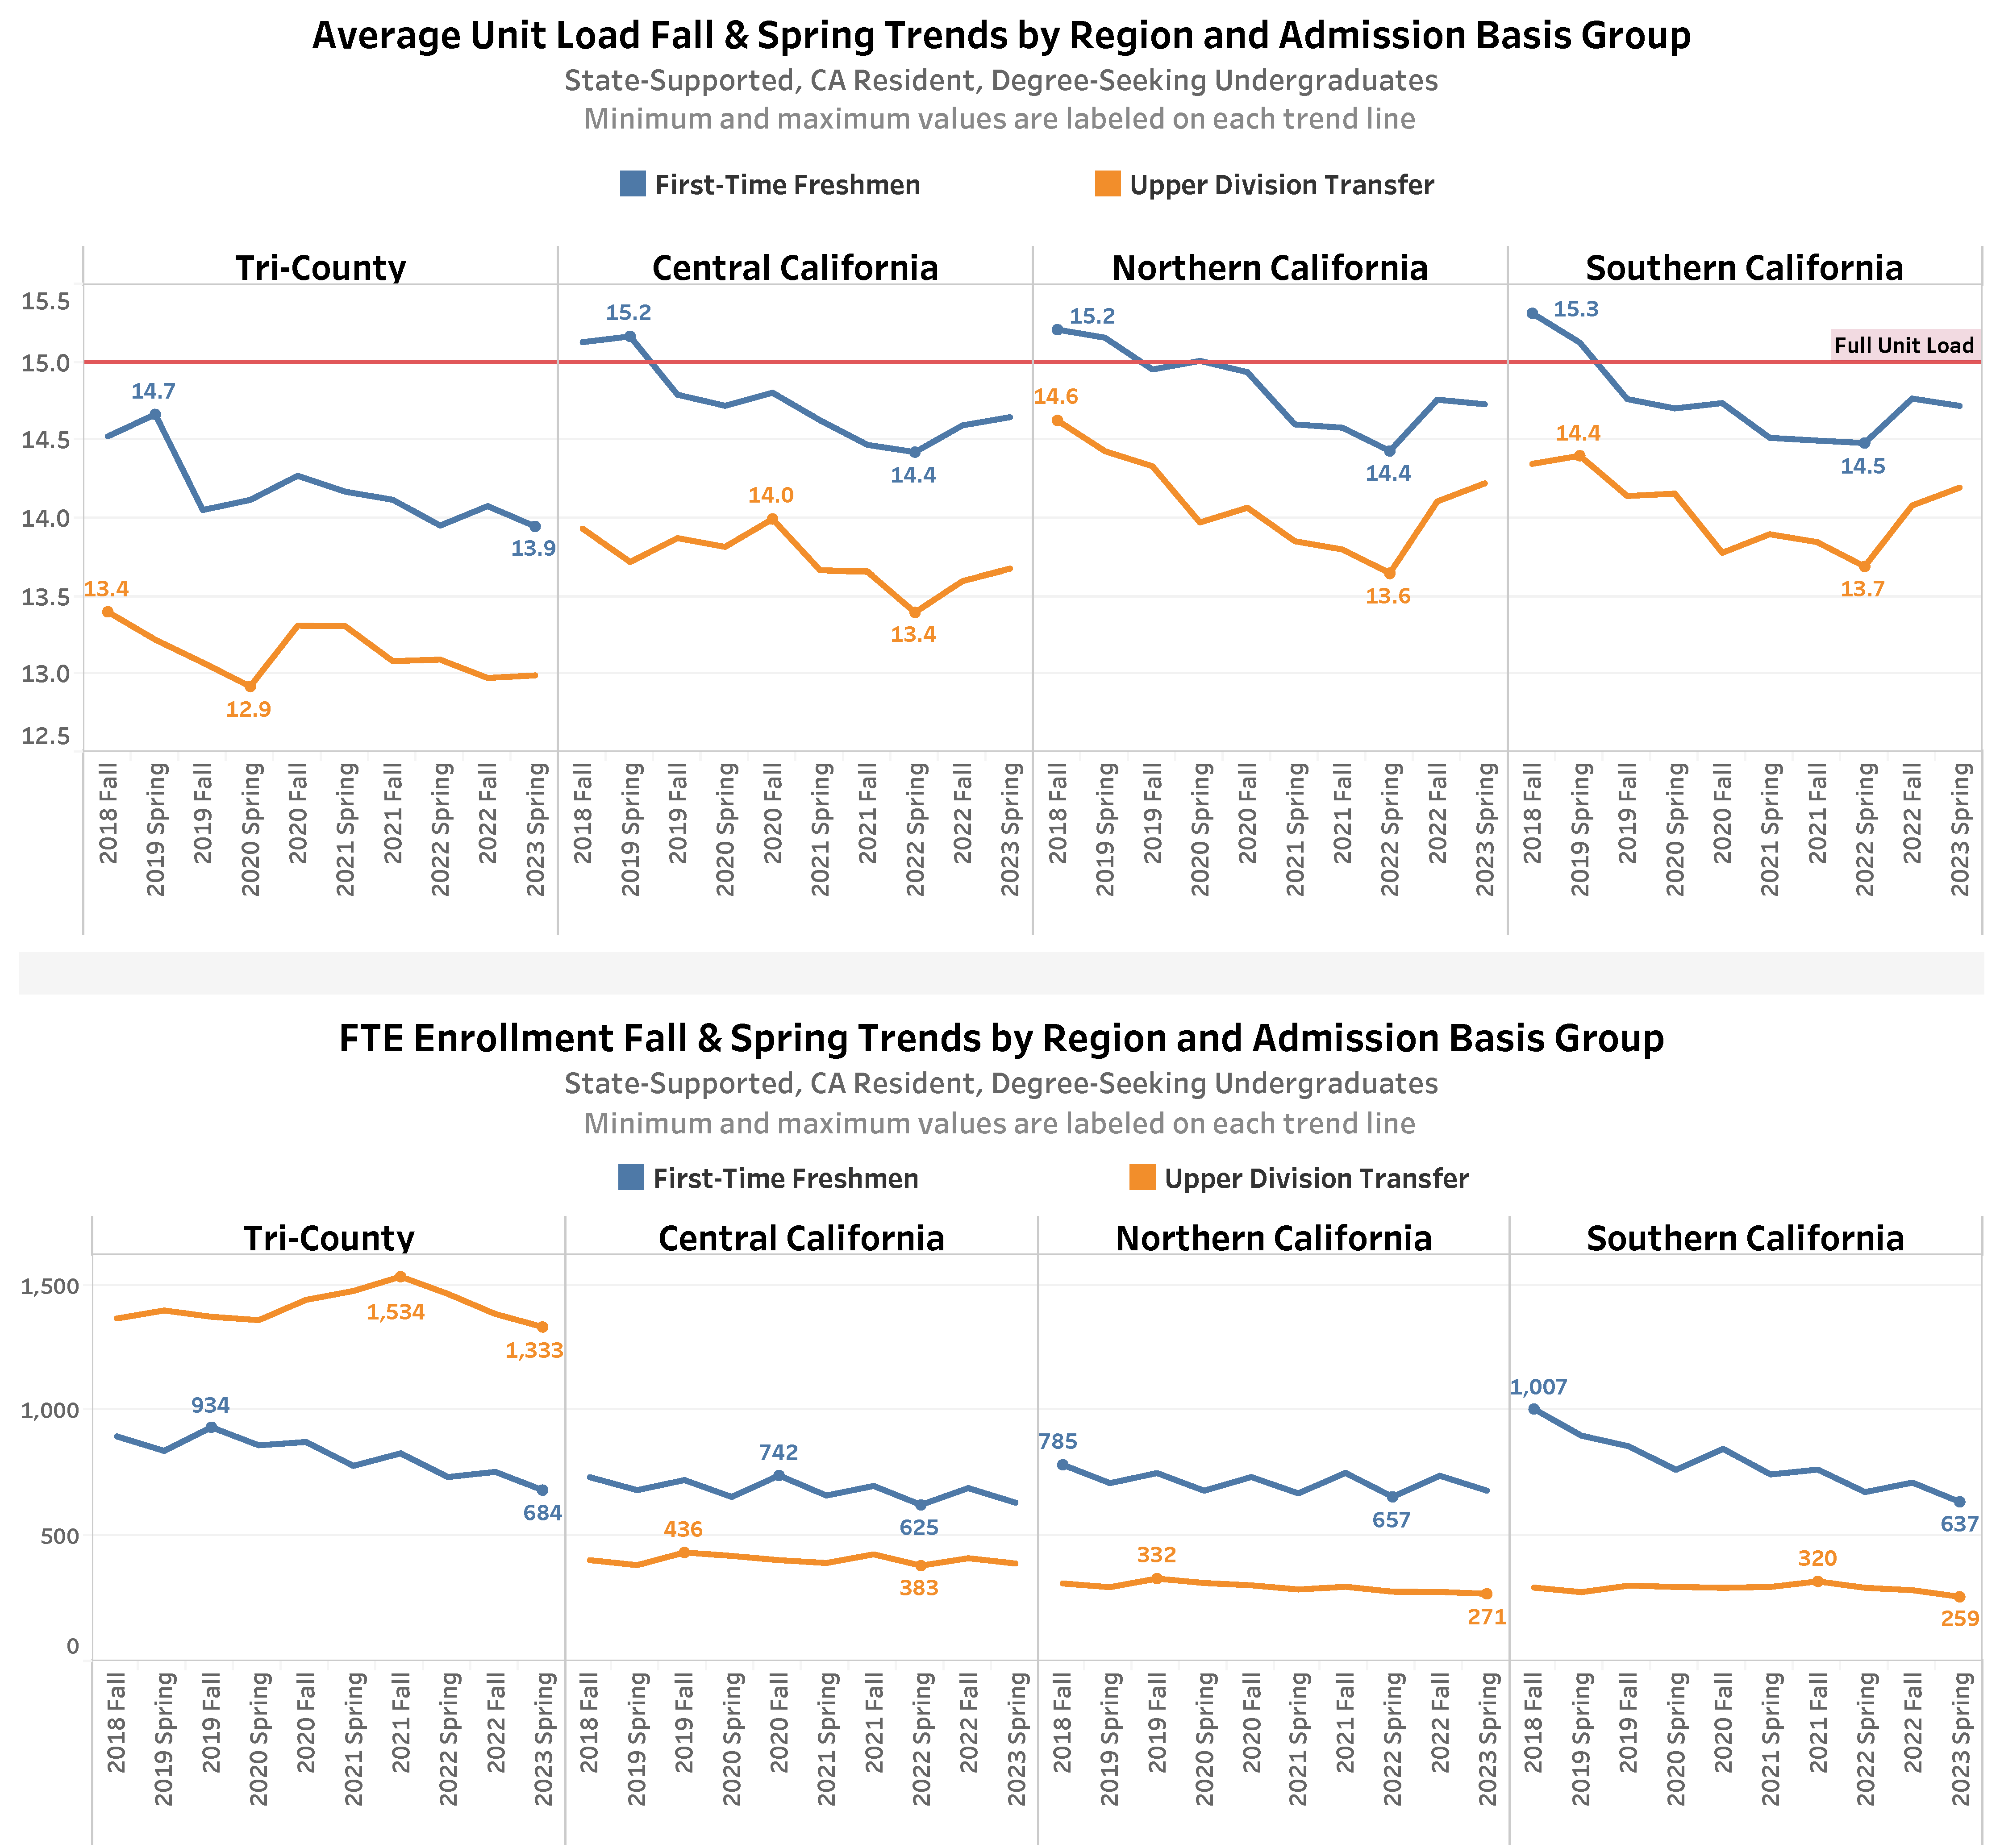
Note: 2023 Spring data points are preliminary (pre-census) and subject to change. “Other Countries” and “Other States” Region Groupings and “Lower Division Transfer” and “Transitory” Admission Basis Group groupings are not shown because of small numbers.
Data Source: CSUMB Data Warehouse
Average Unit Load and Full Time Equivalent (FTE) Enrollment Fall & Spring Trends by Region and Admission Basis Group
Region
Admission Basis Group
Metric
2018 Fall
2019 Spring
2019 Fall
2020 Spring
2020 Fall
2021 Spring
2021 Fall
2022 Spring
2022 Fall
2023 Spring
Tri-County
First-Time Freshmen
Average Unit Load
14.5
14.7
14.1
14.1
14.3
14.2
14.1
14.0
14.1
13.9
Tri-County
First-Time Freshmen
FTE Enrollment
898
840
934
862
875
780
830
736
756
684
Tri-County
Upper Division Transfer
Average Unit Load
13.4
13.2
13.1
12.9
13.3
13.3
13.1
13.1
13.0
13.0
Tri-County
Upper Division Transfer
FTE Enrollment
1,367
1,399
1,374
1,360
1,441
1,477
1,534
1,465
1,385
1,333
Central California
First-Time Freshmen
Average Unit Load
15.1
15.2
14.8
14.7
14.8
14.6
14.5
14.4
14.6
14.6
Central California
First-Time Freshmen
FTE Enrollment
735
684
724
657
742
662
700
625
692
634
Central California
Upper Division Transfer
Average Unit Load
13.9
13.7
13.9
13.8
14.0
13.7
13.7
13.4
13.6
13.7
Central California
Upper Division Transfer
FTE enrollment
405
385
436
422
405
394
428
383
413
392
Northern California
First-Time Freshmen
Average Unit Load
15.2
15.2
15.0
15.0
14.9
14.6
14.6
14.4
14.8
14.7
Northern California
First-Time Freshmen
FTE Enrollment
785
711
752
681
736
671
752
657
741
682
Northern California
Upper Division Transfer
Average Unit Load
14.6
14.4
14.3
14.0
14.1
13.9
13.8
13.6
14.1
14.2
Northern California
Upper Division Transfer
FTE Enrollment
312
297
332
314
305
288
299
279
278
271
Southern California
First-Time Freshmen
Average Unit Load
15.3
15.1
14.8
14.7
14.7
14.5
14.5
14.5
14.8
14.7
Southern California
First-Time Freshmen
FTE Enrollment
1,007
901
858
765
848
746
766
676
714
637
Southern California
Upper Division Transfer
Average Unit Load
14.3
14.4
14.1
14.2
13.8
13.9
13.8
13.7
14.1
14.2
Southern California
Upper Division Transfer
FTE Enrollment
296
277
304
298
295
298
320
295
285
259
First Generation and Admission Basis Group
- For FTF, the trends in average unit loads by fall and spring terms are relatively similar regardless of First Generation status; those that are not first generation have had slightly higher average unit loads.
- For UDTs the average unit loads of first generation students have been in decline since 2020 Fall while the average unit loads of not first generation UDTs have begun to trend higher since 2022 Spring.
- FTE enrollment for first generation FTF have been in decline since 2018 Fall, while FTE enrollment for first generation UDTs have been in decline since 2021 Fall.
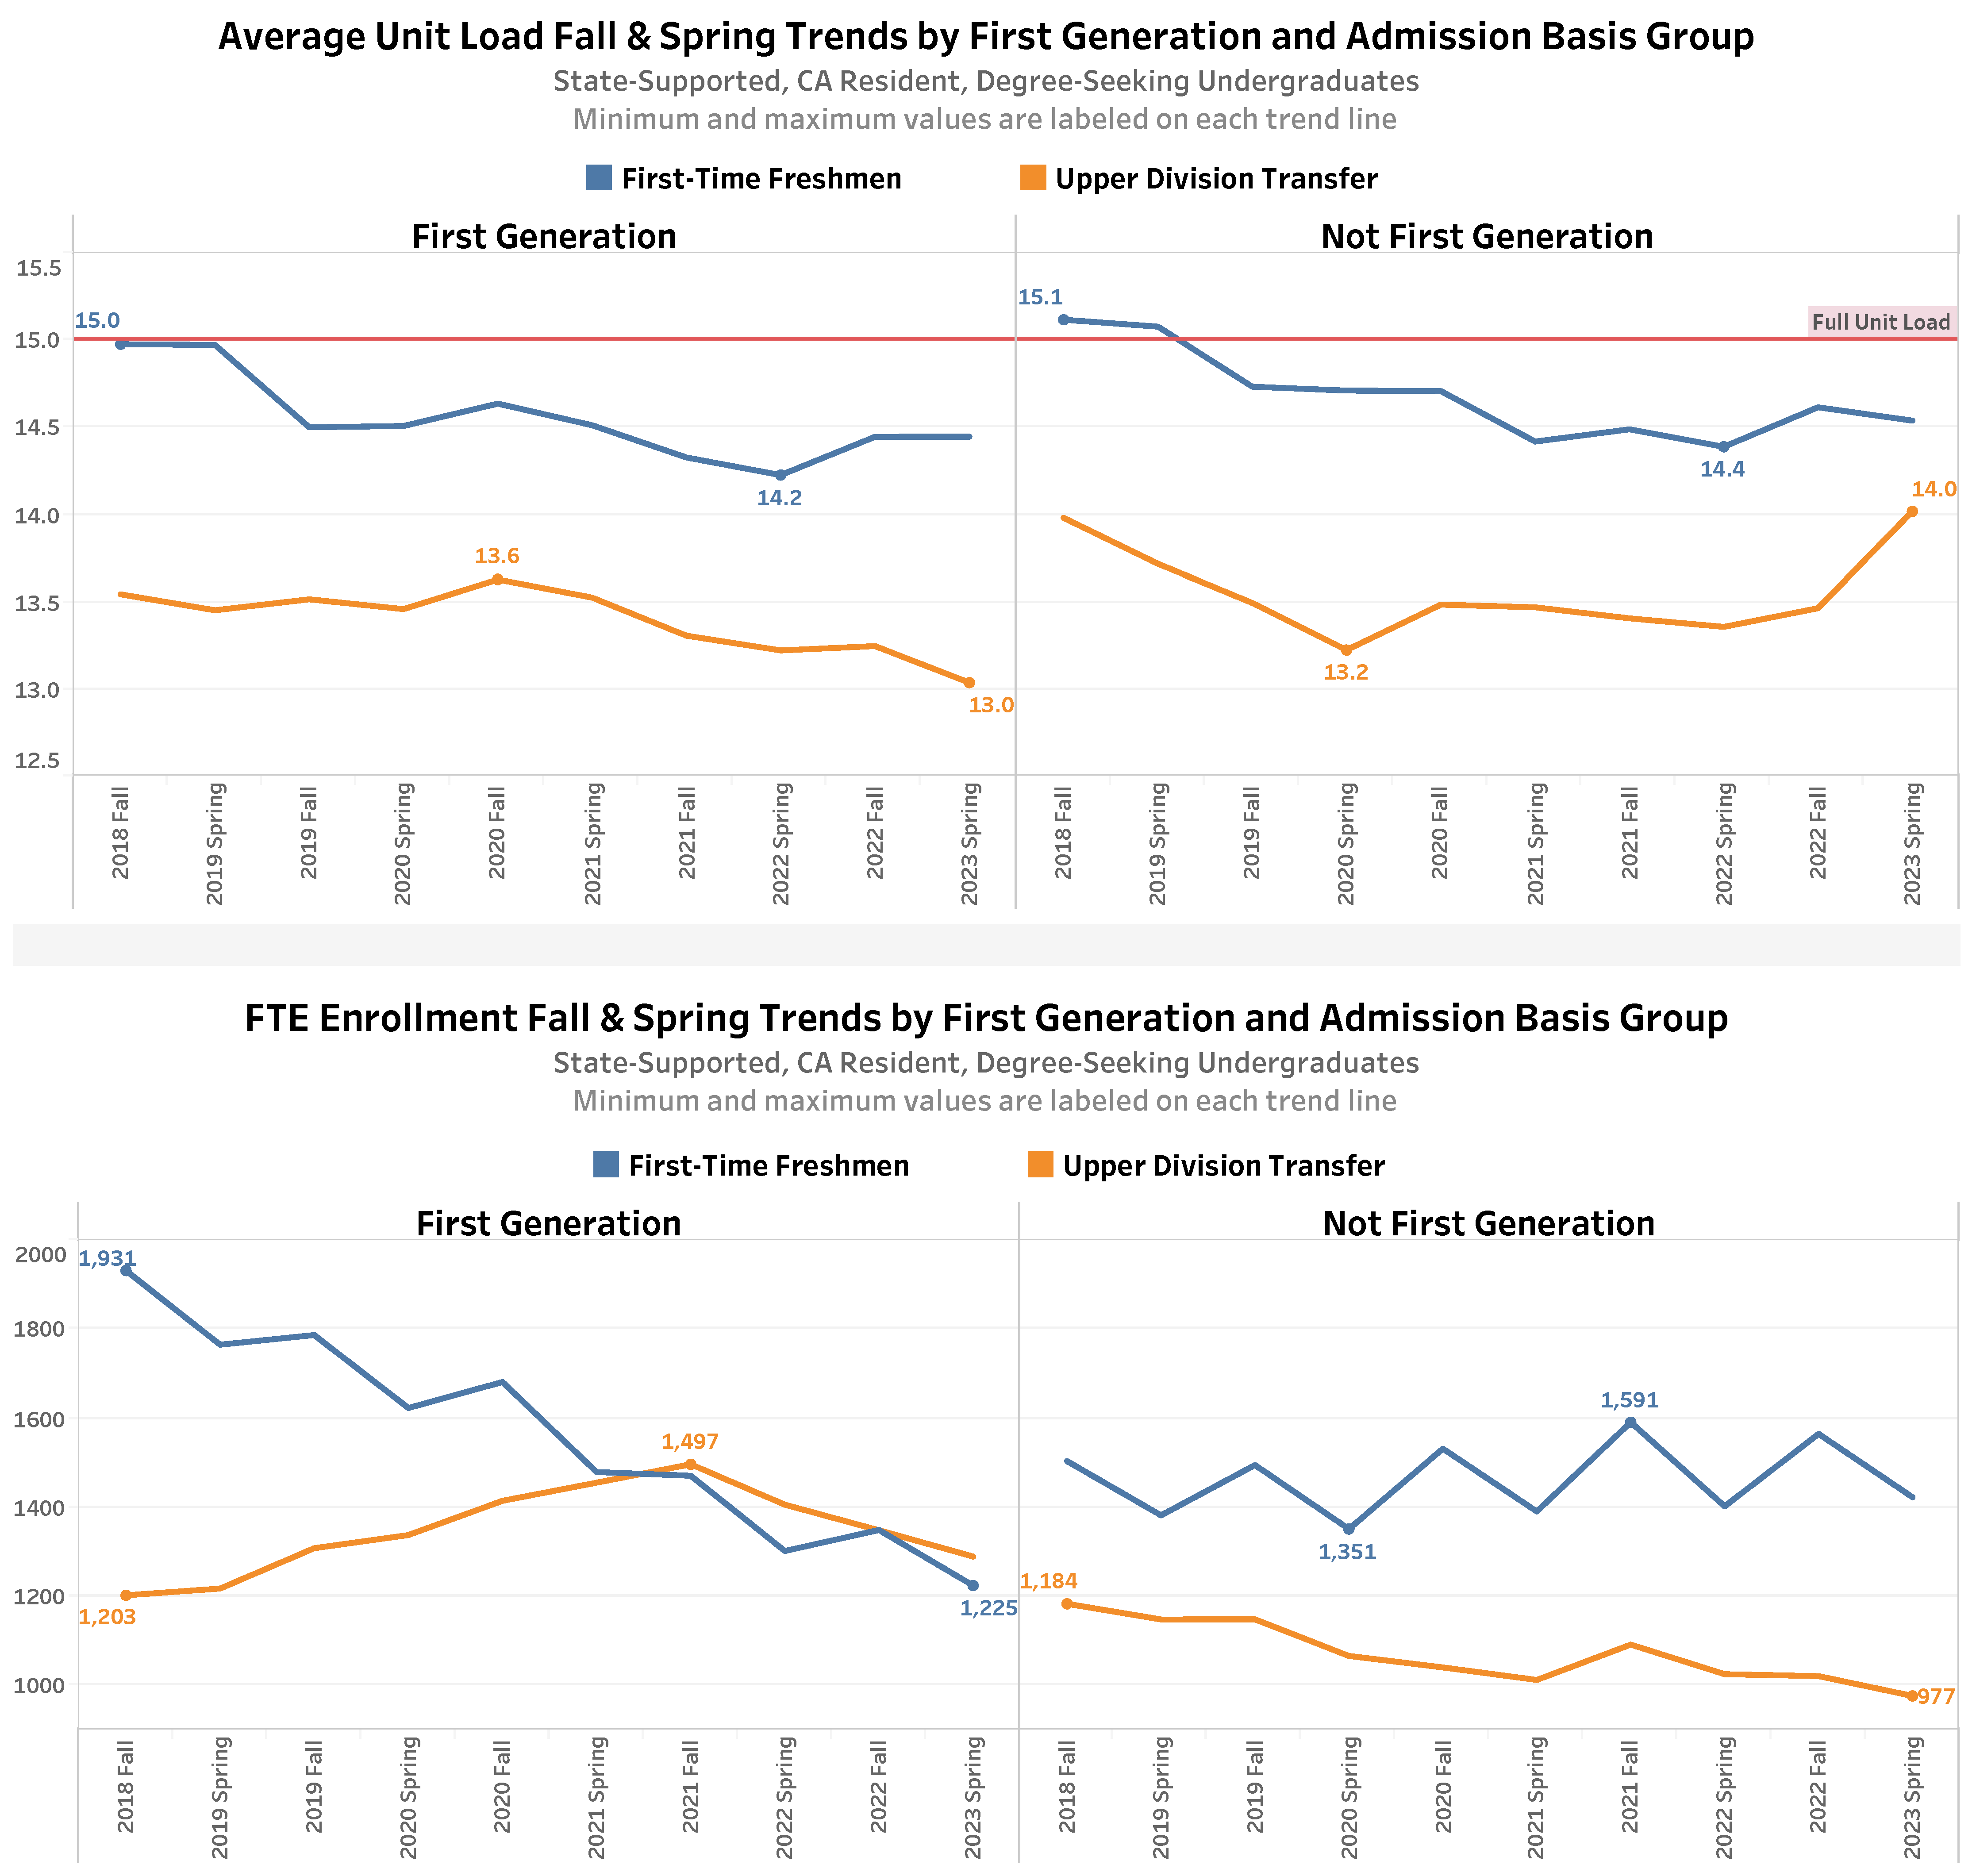
Note: 2023 Spring data points are preliminary (pre-census) and subject to change. “Lower Division Transfer” and “Transitory” Admission Basis Group groupings are not shown because of small numbers.
Data Source: CSUMB Data Warehouse
Average Unit Load and Full Time Equivalent (FTE) Enrollment Fall & Spring Trends by First Generation and Admission Basis Group
First Generation Status
Admission Basis Group
Metric
2018 Fall
2019 Spring
2019 Fall
2020 Spring
2020 Fall
2021 Spring
2021 Fall
2022 Spring
2022 Fall
2023 Spring
First Generation
First-Time Freshmen
Average Unit Load
15.0
15.0
14.5
14.5
14.6
14.5
14.3
14.2
14.4
14.4
First Generation
First-Time Freshmen
FTE Enrollment
1,931
1,765
1,786
1,623
1,681
1,479
1,471
1,302
1,349
1,225
First Generation
Upper Division Transfer
Average Unit Load
13.5
13.5
13.5
13.5
13.6
13.5
13.3
13.2
13.2
13.0
First Generation
Upper Division Transfer
FTE Enrollment
1,203
1,218
1,308
1,338
1,415
1,455
1,497
1,406
1,349
1,290
Not First Generation
First-Time Freshmen
Average Unit Load
15.1
15.1
14.7
14.7
14.7
14.4
14.5
14.4
14.6
14.5
Not First Generation
First-Time Freshmen
FTE Enrollment
1,504
1,382
1,495
1,351
1,532
1,391
1,591
1,402
1,565
1,423
Not First Generation
Upper Division Transfer
Average Unit Load
14.0
13.7
13.5
13.2
13.5
13.5
13.4
13.4
13.5
14.0
Not First Generation
Upper Division Transfer
FTE Enrollment
1,184
1,149
1,149
1,067
1,041
1,013
1,092
1,026
1,022
977
Received Pell Aid and Admission Basis Group
- For FTF, the trends in average unit loads by fall and spring terms are relatively similar regardless of whether or not they Received Pell Aid.
- For UDTs the average unit loads of those that received Pell aid have been in decline since 2020 Fall while the average unit loads of those that did not receive Pell aid have begun to trend higher since 2021 Fall.
- FTE enrollment for FTF that received Pell aid have been in decline since 2018 Fall, while FTE enrollment for UDTs that received Pell aid have been in decline since 2021 Fall.
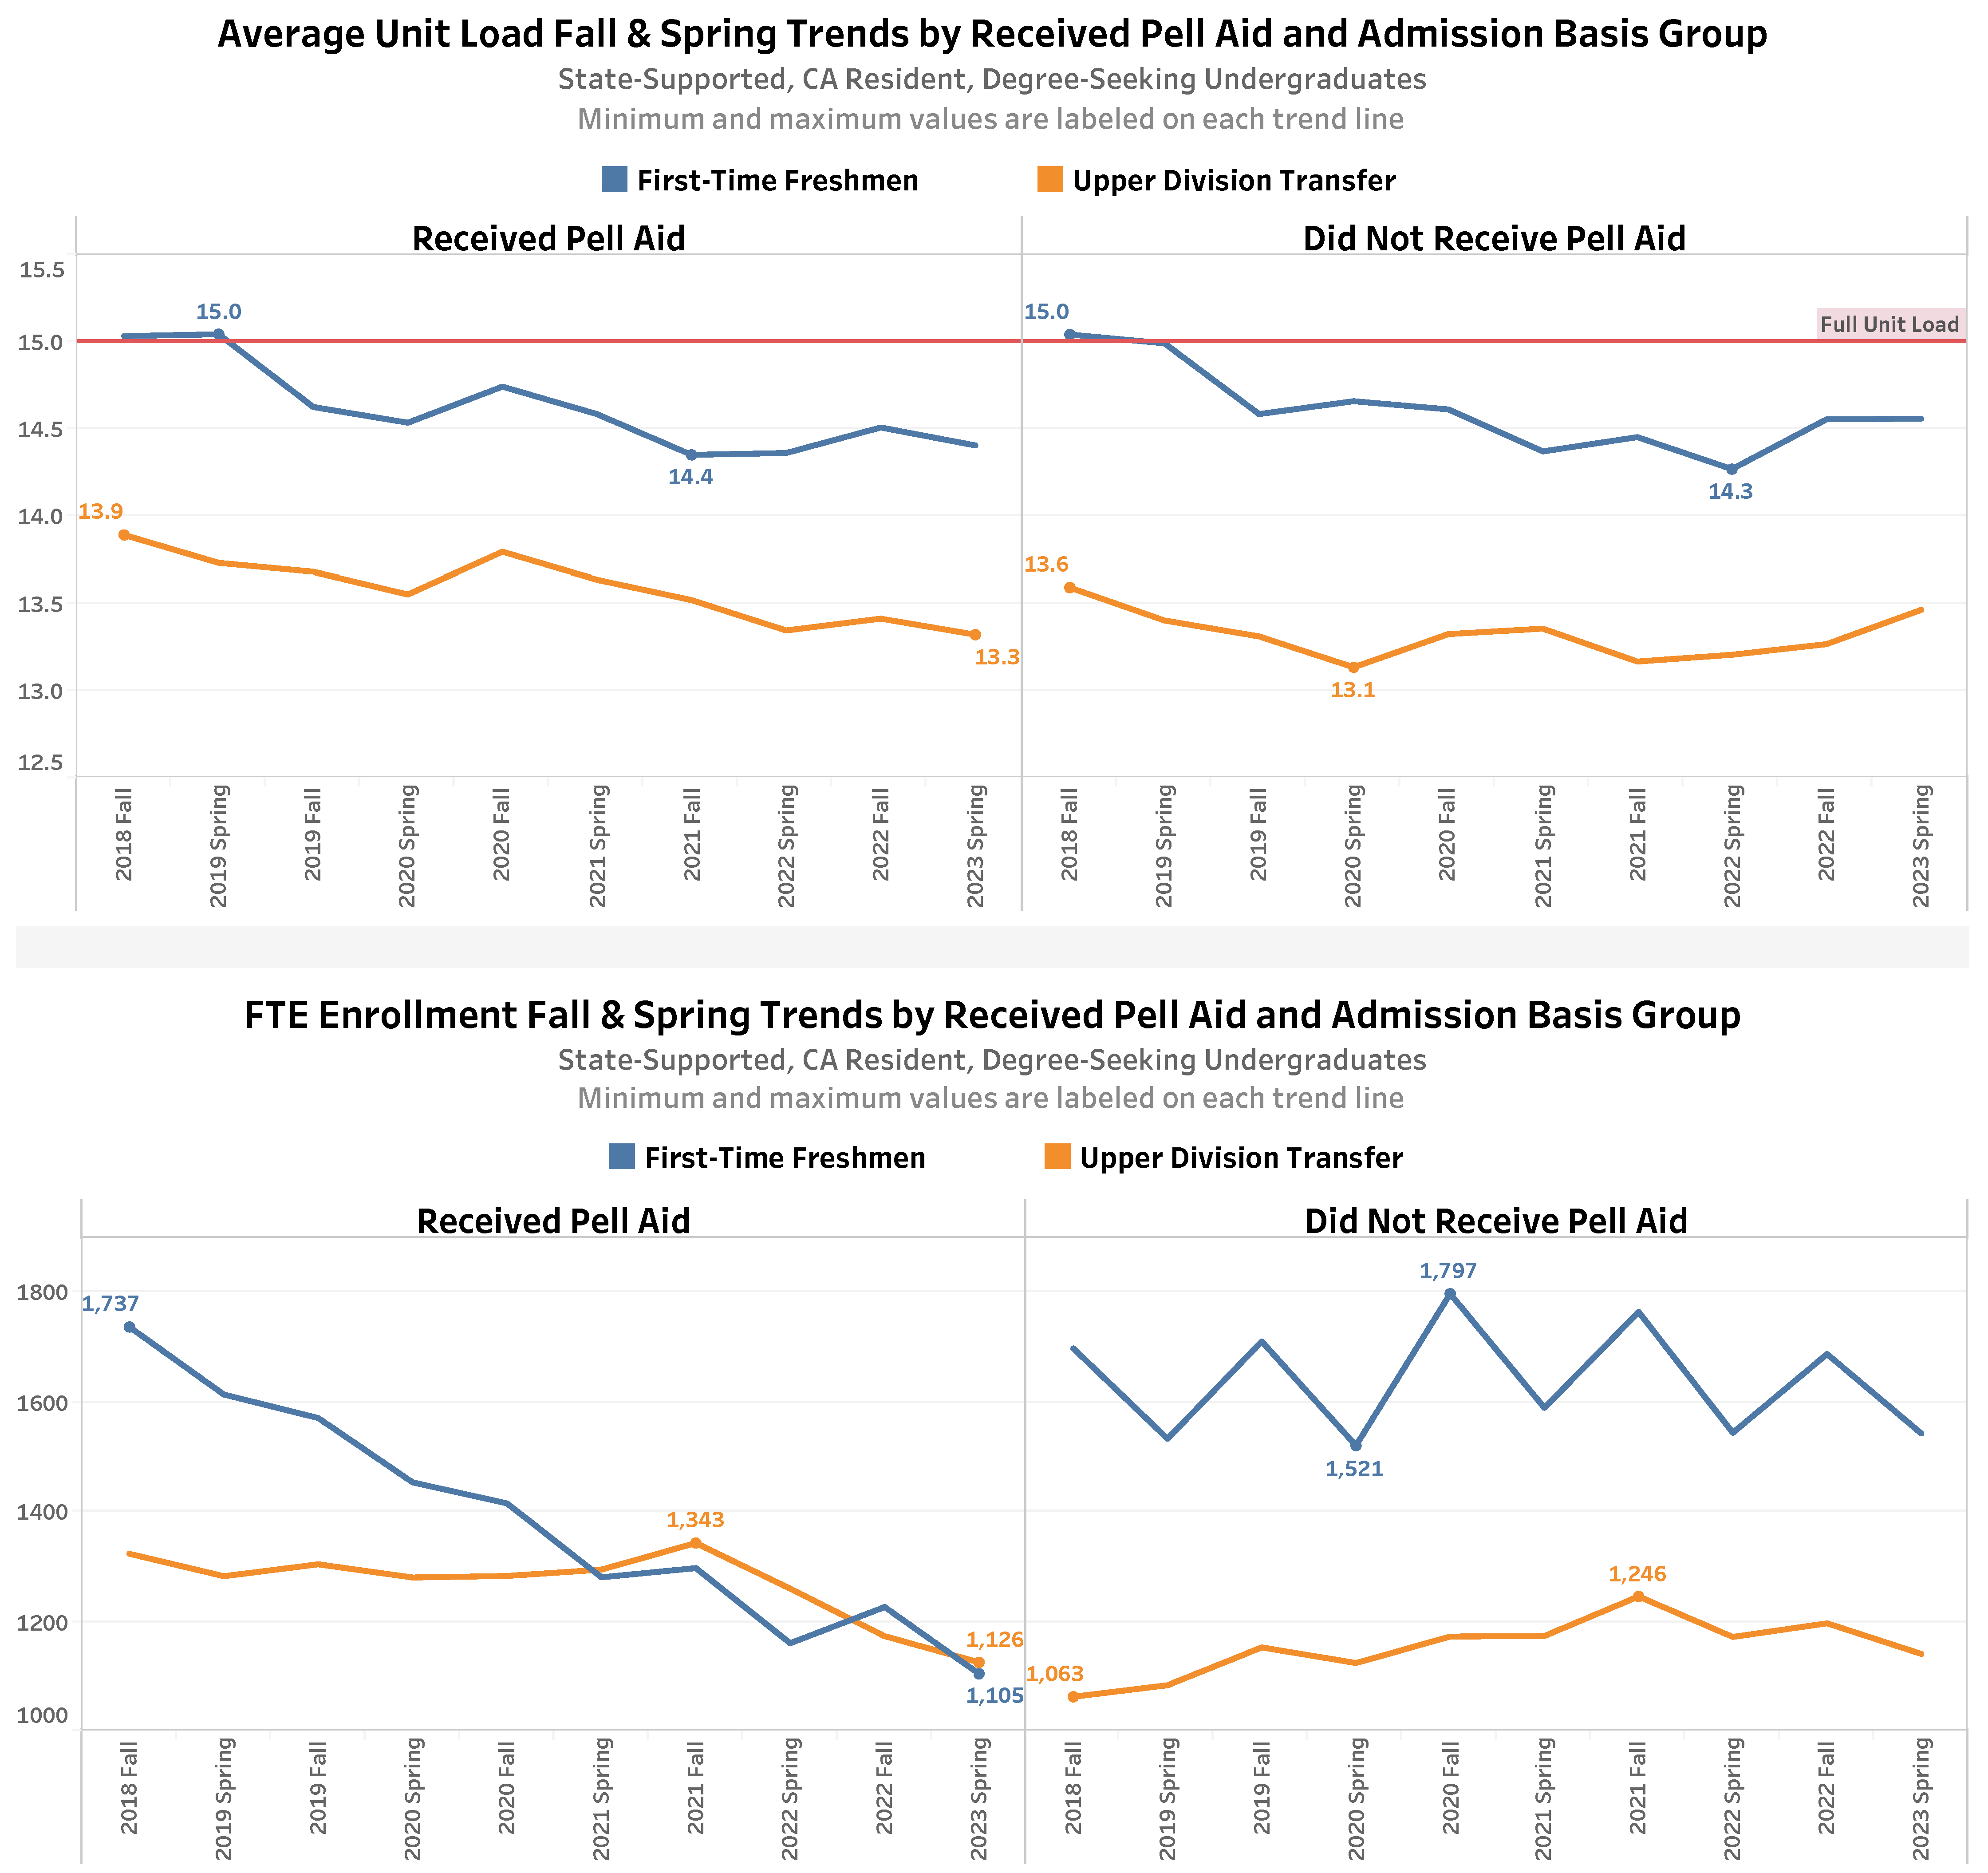
Note: 2023 Spring data points are preliminary (pre-census) and subject to change. “Lower Division Transfer” and “Transitory” Admission Basis Group groupings are not shown because of small numbers.
Average Unit Load and Full Time Equivalent (FTE) Enrollment Fall & Spring Trends by Received Pell Aid and Admission Basis Group
Received Pell Aid Status
Admission Basis Group
Metric
2018 Fall
2019 Spring
2019 Fall
2020 Spring
2020 Fall
2021 Spring
2021 Fall
2022 Spring
2022 Fall
2023 Spring
Received Pell Aid
First-Time Freshmen
Average Unit Load
15.0
15.0
14.6
14.5
14.7
14.6
14.4
14.4
14.5
14.4
Received Pell Aid
First-Time Freshmen
FTE Enrollment
1,737
1,614
1,571
1,454
1,415
1,281
1,297
1,160
1,226
1,105
Received Pell Aid
Upper Division Transfer
Average Unit Load
13.9
13.7
13.7
13.6
13.8
13.6
13.5
13.3
13.4
13.3
Received Pell Aid
Upper Division Transfer
FTE Enrollment
1,323
1,283
1,304
1,280
1,283
1,295
1,343
1,260
1,173
1,126
Did Not Receive Pell Aid
First-Time Freshmen
Average Unit Load
15.0
15.0
14.6
14.7
14.6
14.4
14.5
14.3
14.6
14.6
Did Not Receive Pell Aid
First-Time Freshmen
FTE Enrollment
1,698
1,533
1,710
1,521
1,797
1,589
1,764
1,544
1,687
1,543
Did Not Receive Pell Aid
Upper Division Transfer
Average Unit Load
13.6
13.4
13.3
13.1
13.3
13.4
13.2
13.2
13.3
13.5
Did Not Receive Pell Aid
Upper Division Transfer
FTE Enrollment
1,063
1,084
1,153
1,124
1,173
1,174
1,246
1,172
1,197
1,141
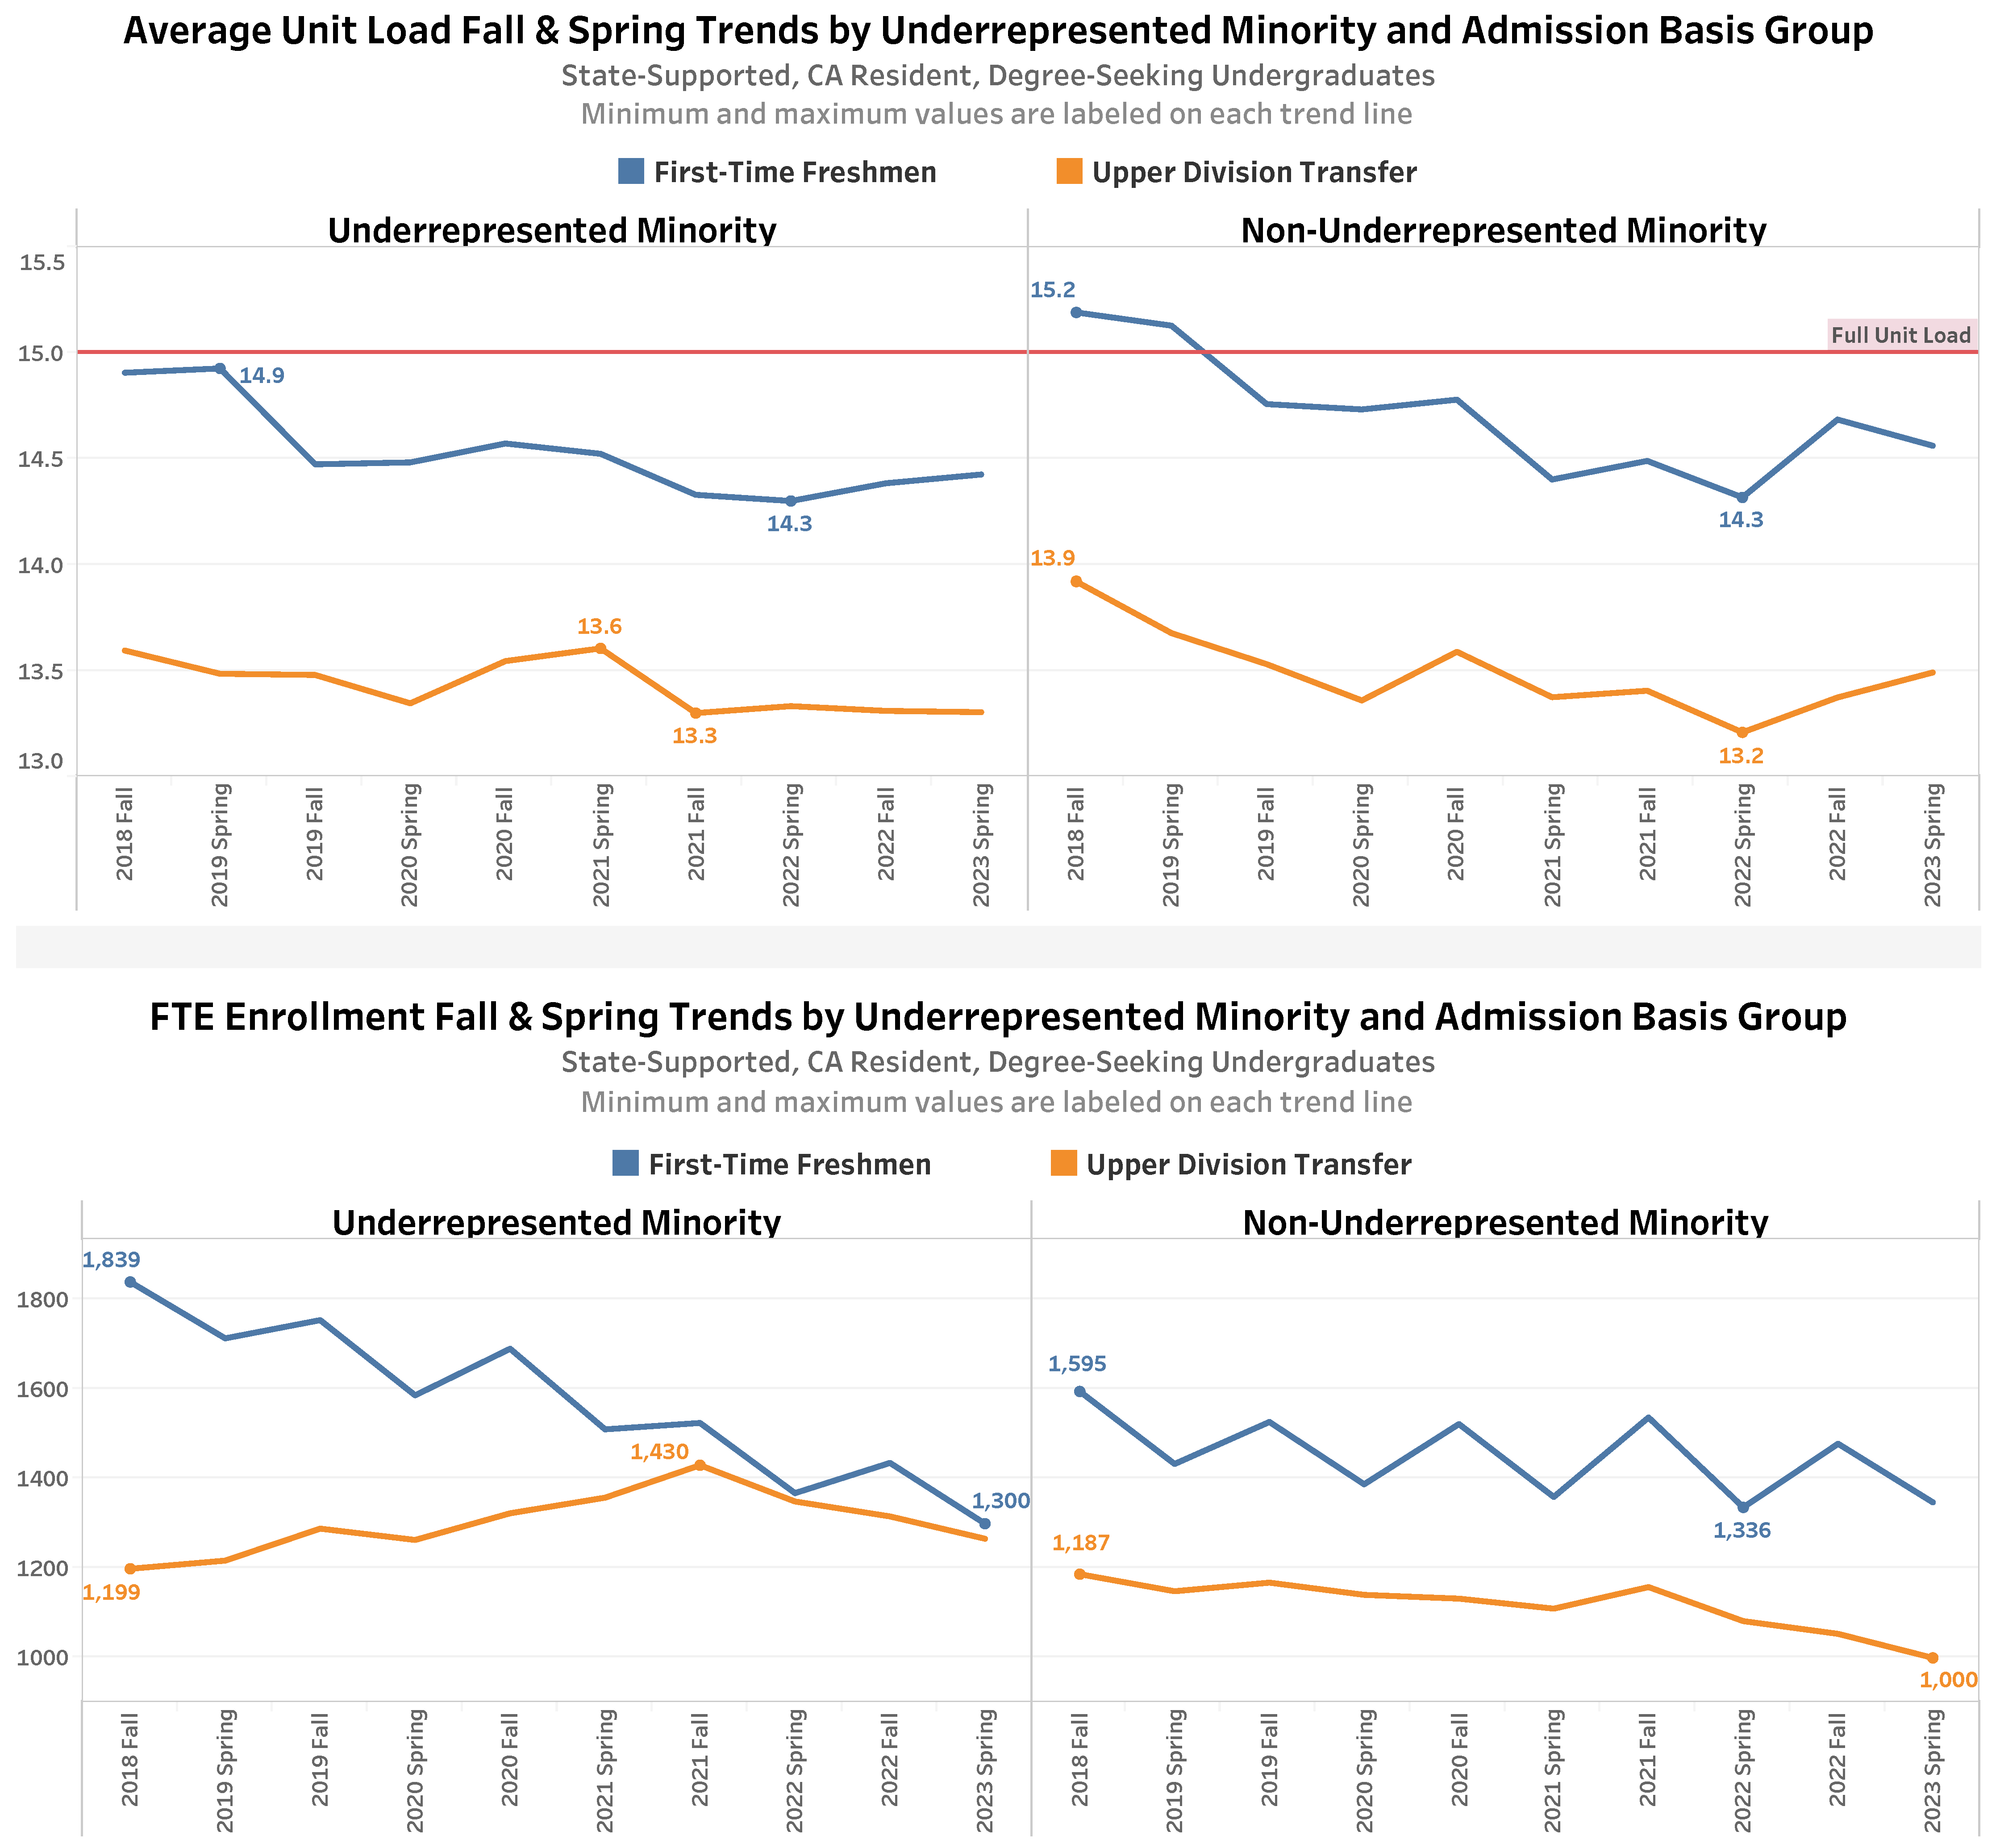
Underrepresented Minority and Admission Basis Group
- For FTF that are Underrepresented Minority (URM), average unit loads have tended to trend somewhat lower than those that are non-URM.
- For URM UDTs, average unit loads have been fairly consistently close to 13.5 average units have declined slightly to 13.3 average units since 2021 Fall. For non-URM UDTs, average unit loads declined after 2018 Fall, reaching a minimum of 13.2 in 2022 Spring, but have begun to increase slightly since then.
- Declines in FTF FTE enrollments are more pronounced for those that are URM, but declines are observed across non-URM FTF as well.
- For UDTs, non-URM FTE enrollment has trended downward since 2018 Fall, but a more pronounced decline is observed after 2021 Fall for URM UDT FTE enrollment.
Note: 2023 Spring data points are preliminary (pre-census) and subject to change. “Lower Division Transfer” and “Transitory” Admission Basis Group groupings are not shown because of small numbers.
Data Source: CSUMB Data Warehouse
Average Unit Load and Full Time Equivalent (FTE) Enrollment Fall & Spring Trends by Underrepresented Minority and Admission Basis Group
Underrepresented Minority Status
Admission Basis Group
Metric
2018 Fall
2019 Spring
2019 Fall
2020 Spring
2020 Fall
2021 Spring
2021 Fall
2022 Spring
2022 Fall
2023 Spring
Underrepresented Minority
First-Time Freshmen
Average Unit Load
14.9
14.9
14.5
14.5
14.6
14.5
14.3
14.3
14.4
14.4
Underrepresented Minority
First-Time Freshmen
FTE Enrollment
1,839
1,714
1,754
1,586
1,690
1,510
1,525
1,368
1,436
1,300
Underrepresented Minority
Upper Division Transfer
Average Unit Load
13.6
13.5
13.5
13.3
13.5
13.6
13.3
13.3
13.3
13.3
Underrepresented Minority
Upper Division Transfer
FTE Enrollment
1,199
1,217
1,289
1,264
1,323
1,358
1,430
1,349
1,316
1,266
Non-Underrepresented Minority
First-Time Freshmen
Average Unit Load
15.2
15.1
14.8
14.7
14.8
14.4
14.5
14.3
14.7
14.6
Non-Underrepresented Minority
First-Time Freshmen
FTE Enrollment
1,595
1,433
1,527
1,388
1,522
1,360
1,537
1,336
1,478
1,348
Non-Underrepresented Minority
Upper Division Transfer
Average Unit Load
13.9
13.7
13.5
13.4
13.6
13.4
13.4
13.2
13.4
13.5
Non-Underrepresented Minority
Upper Division Transfer
FTE Enrollment
1,187
1,149
1,168
1,141
1,133
1,110
1,158
1,082
1,054
1,000
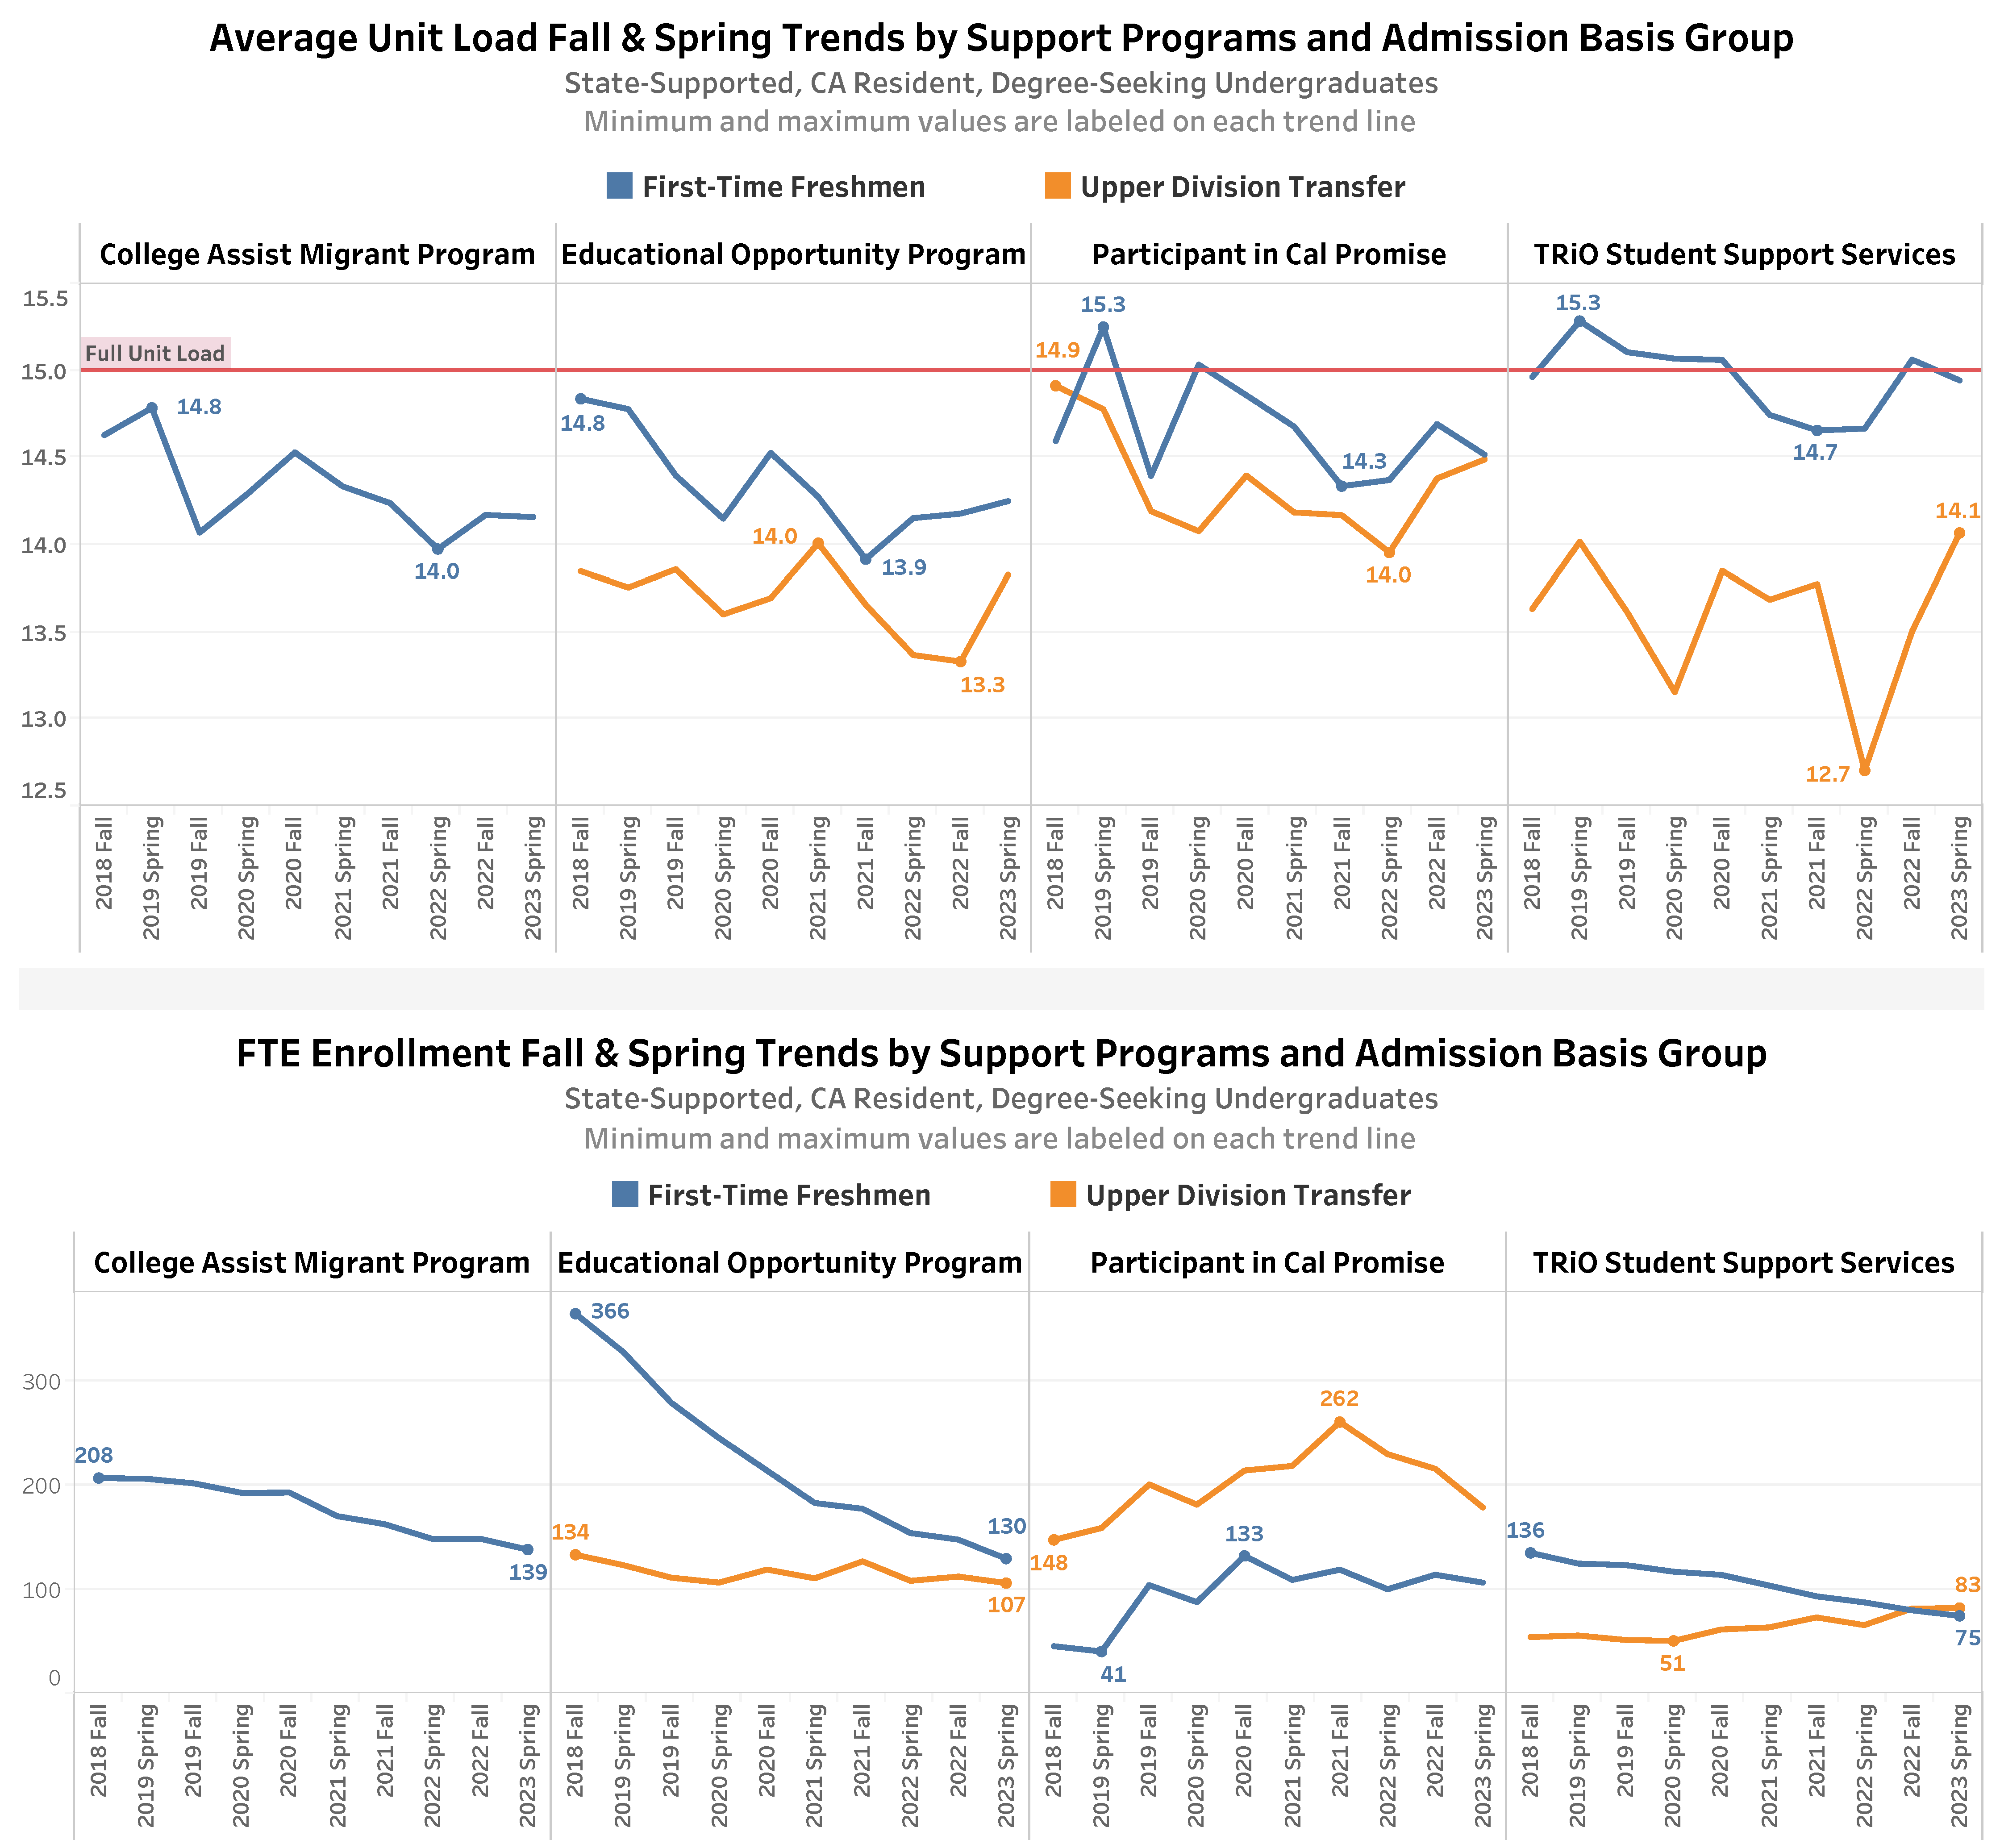
Support Programs and Admission Basis Group
- Average unit loads trends for participants in various campus support programs:
- For FTF in the College Assistance Migrant Program (CAMP) and the Educational Opportunity Program (EOP), average unit loads have been slightly lower than the average unit loads observed across other FTF groupings visualized in the sections above.
- For FTF participating in California Promise and TRiO Student Support Services, average unit loads have been somewhat closer to a Full Unit Load (15 units), particularly for TRiO-supported students in recent terms.
- For UDTs, average unit load trends for participants in California Promise have been higher than for some of the other UDT groupings visualized in the sections above.
- The UDT participants in TRiO Student Support Services have more variability in average unit load trends.
- FTE enrollment trends for participants in various campus support programs:
- For FTF, FTE enrollment by participants in CAMP, EOP, and TRiO have all been in decline since 2018 Fall; a significantly larger decrease in FTE enrollment is observed for FTF EOP participants.
- For UDTs, FTE enrollment by participants in EOP has declined somewhat from 2018 Fall.
- For UDT participants in California Promise, FTE enrollment was trending upward until 2021 Fall but has since been in decline.
- For UDT participants in TRiO Student Support Services, FTE enrollments have increased somewhat since 2020 Spring.
Note: 2023 Spring data points are preliminary (pre-census) and subject to change. Not all Support Programs are shown. “Lower Division Transfer” and “Transitory” Admission Basis Group groupings are not shown because of small numbers. A small number of “Upper Division Transfers” in the “College Assist Migrant Program” (CAMP) are also not shown. Eligibility for CAMP includes first-time freshman and full-time status.
Data Source: CSUMB Data Warehouse
Average Unit Load and Full Time Equivalent (FTE) Enrollment Fall & Spring Trends by Support Programs and Admission Basis Group
Support Programs
Admission Basis Group
Metric
2018 Fall
2019 Spring
2019 Fall
2020 Spring
2020 Fall
2021 Spring
2021 Fall
2022 Spring
2022 Fall
2023 Spring
College Assist Migrant Program
First-Time Freshmen
Average Unit Load
14.6
14.8
14.1
14.3
14.5
14.3
14.2
14.0
14.2
14.2
College Assist Migrant Program
First-Time Freshmen
FTE Enrollment
208
207
203
193
194
171
163
149
149
139
Educational Opportunity Program
First-Time Freshmen
Average Unit Load
14.8
14.8
14.4
14.1
14.5
14.3
13.9
14.2
14.2
14.3
Educational Opportunity Program
First-Time Freshmen
FTE Enrollment
366
329
280
246
215
184
178
155
148
130
Educational Opportunity Program
Upper Division Transfer
Average Unit Load
13.8
13.8
13.9
13.6
13.7
14.0
13.7
13.4
13.3
13.8
Educational Opportunity Program
Upper Division Transfer
FTE Enrollment
134
124
112
107
120
111
127
109
113
107
Participant in Cal Promise
First-Time Freshmen
Average Unit Load
14.6
15.3
14.4
15.0
14.9
14.7
14.3
14.4
14.7
14.5
Participant in Cal Promise
First-Time Freshmen
FTE Enrollment
46
41
105
88
133
110
119
101
115
107
Participant in Cal Promise
Upper Division Transfer
Average Unit Load
14.9
14.8
14.2
14.1
14.4
14.2
14.2
14.0
14.4
14.5
Participant in Cal Promise
Upper Division Transfer
FTE Enrollment
148
160
202
182
215
219
262
231
217
179
TRiO Student Support Services
First-Time Freshmen
Average Unit Load
15.0
15.3
15.1
15.1
15.1
14.7
14.7
14.7
15.1
14.9
TRiO Student Support Services
First-Time Freshmen
FTE Enrollment
136
125
124
118
114
104
94
88
80
75
TRiO Student Support Services
Upper Division Transfer
Average Unit Load
13.6
14.0
13.6
13.2
13.9
13.7
13.8
12.7
13.5
14.1
TRiO Student Support Services
Upper Division Transfer
FTE Enrollment
55
56
52
51
62
64
73
66
82
83
What are reasons students may not take 15 units?
In December 2022, Institutional Assessment & Research administered the CSUMB Course Modality and Units Survey, which provided degree-seeking undergraduate students with the opportunity to tell faculty and administrators their preferences in terms of instructional modalities and unit loads: what courses they wish to take, by which modality, the reasons why they may take less than a full load of 15 units, and how they would ideally distribute their units across instructional modalities.
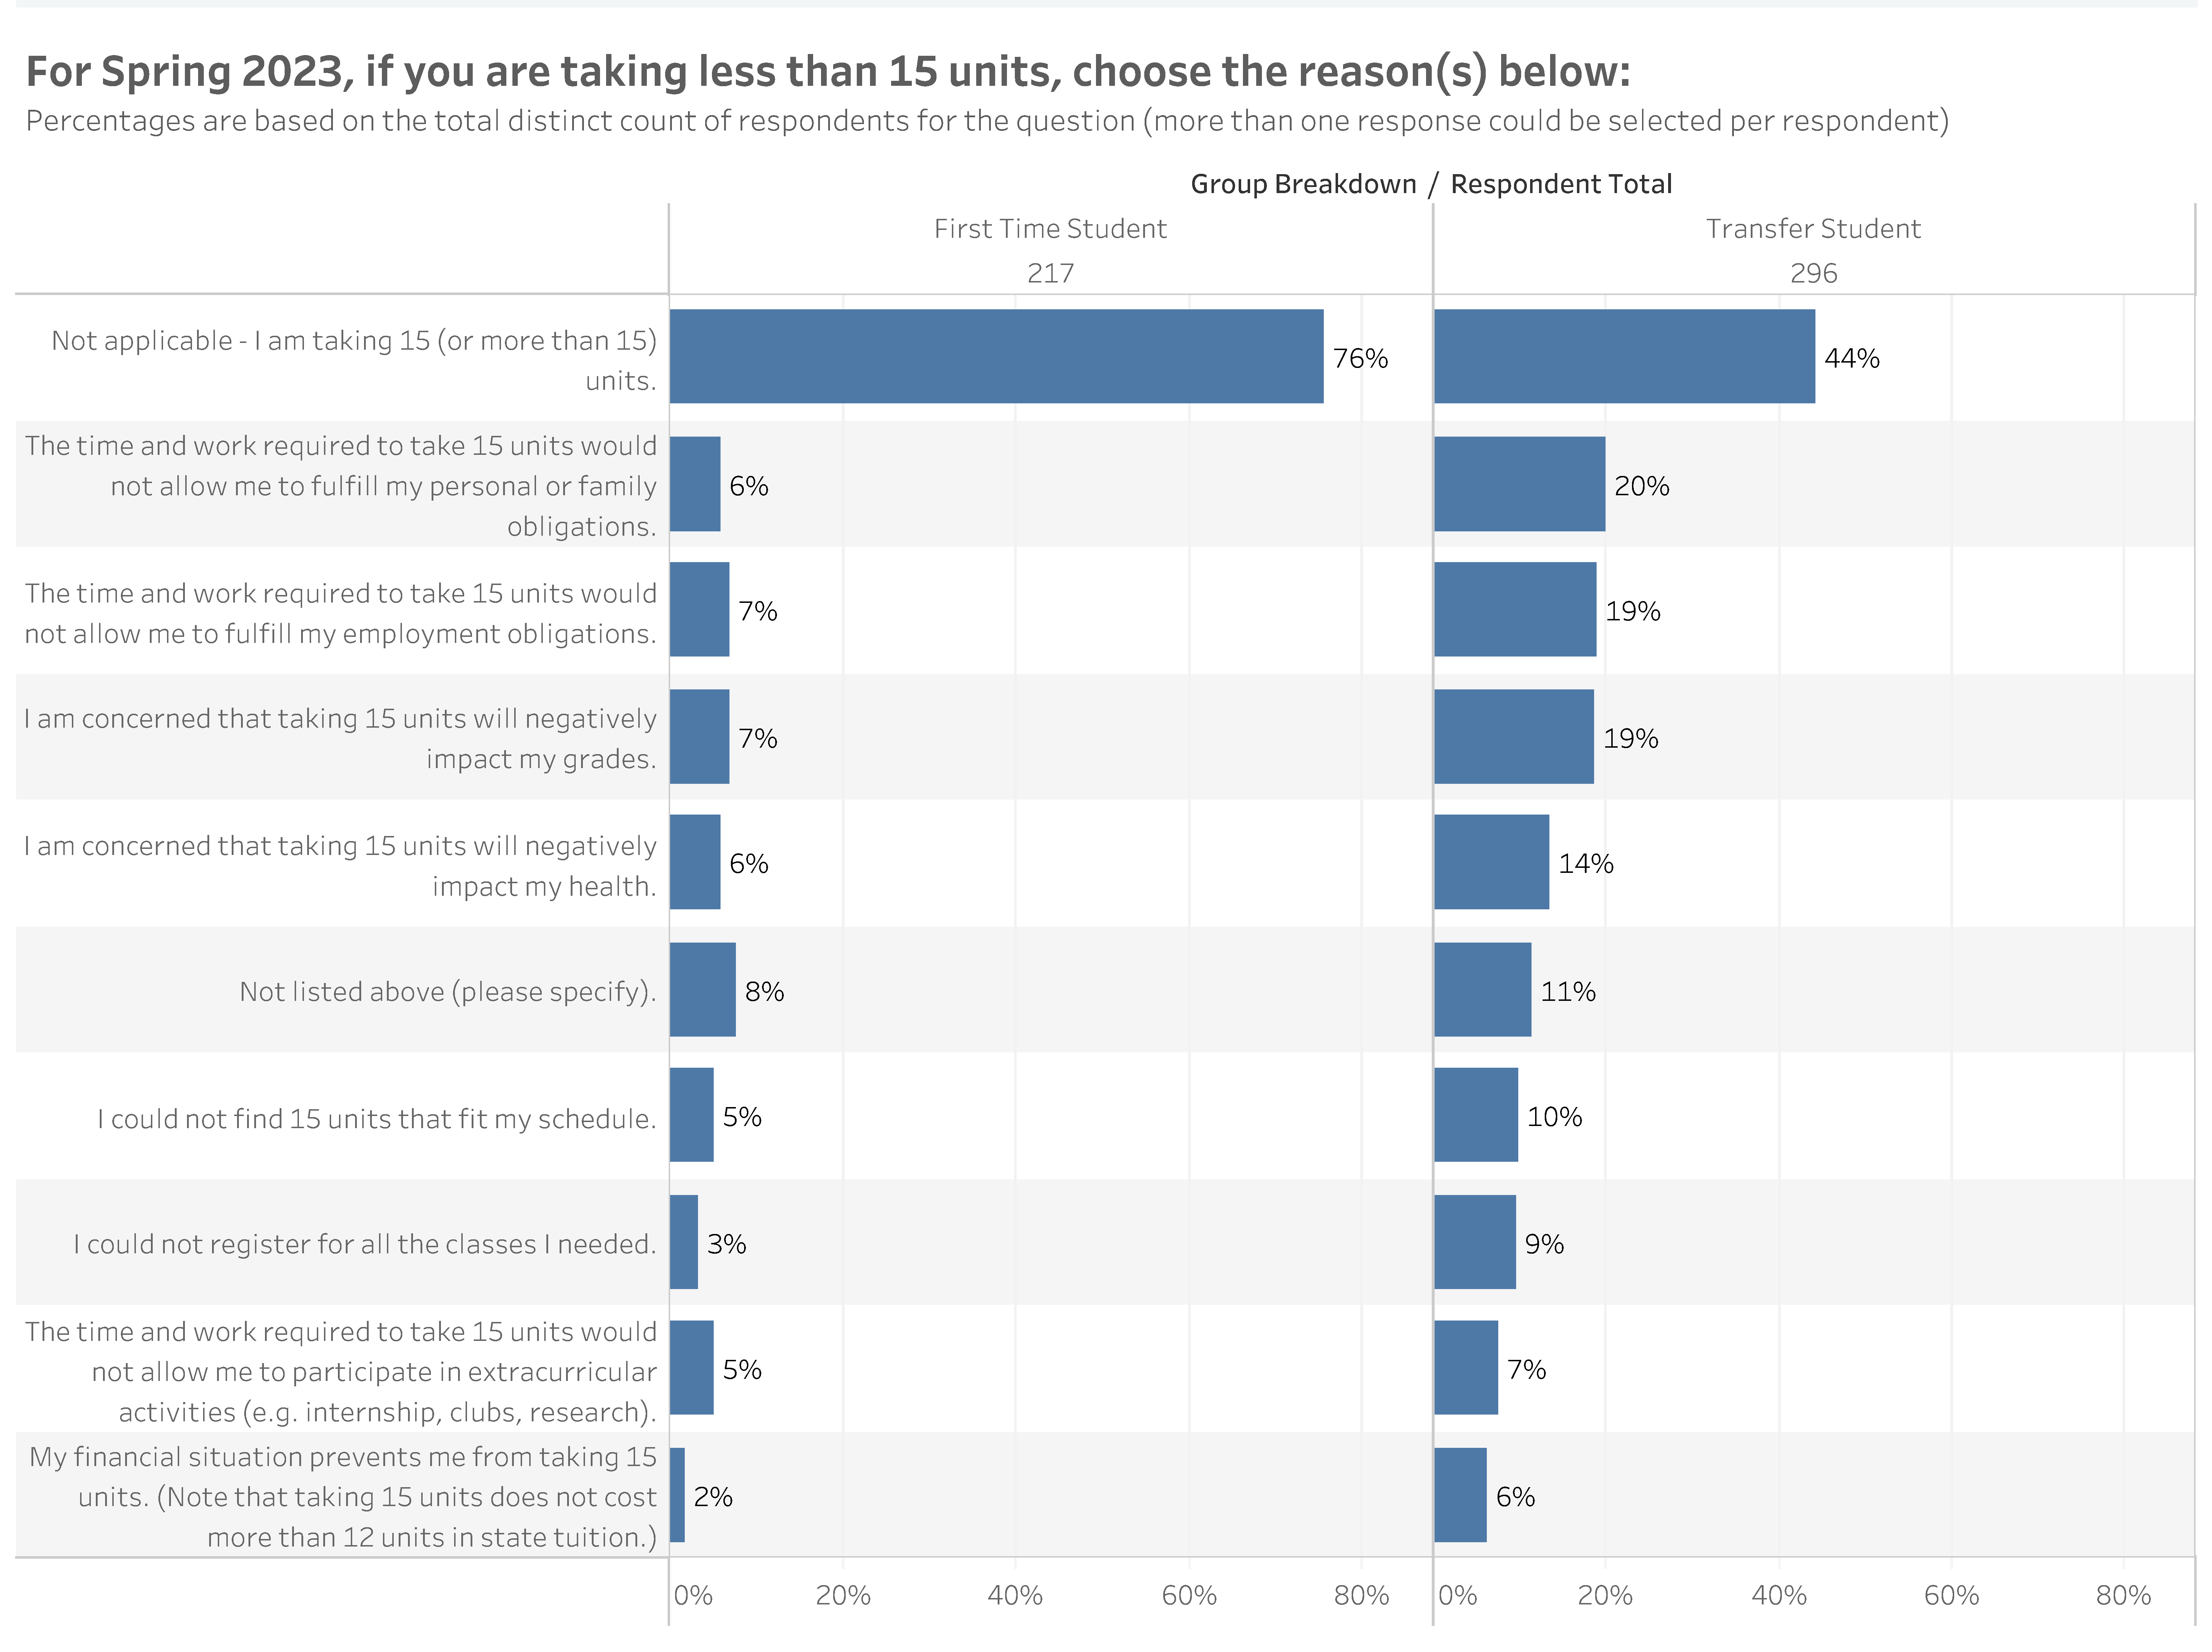
Depicted below are reasons that First-Time and Transfer Students provided for why they registered for less than a full load of 15 units for Spring 2023.
Data Source: CSUMB Course Modality and Units Survey, 2022 Fall.
For Spring 2023, if you are taking less than 15 units, choose the reason(s) below:
Percentages are based on the total distinct count of respondents for the question (more than one response could be selected per respondent).
Question Responses
First-Time Student
(n = 217)
Transfer Student
(n = 296)
Not applicable - I am taking 15 (or more than 15 units
76%
44%
The time and work required to take 15 units would not allow me to fulfill my personal or family obligations
6%
20%
The time and work required to take 15 units would not allow me to fulfill my employment obligations.
7%
19%
I am concerned that taking 15 units will negatively impact my grades
7%
19%
I am concerned that taking 15 units will negatively impact my health.
6%
14%
Not listed above (please specify)
8%
11%
I could not find 15 units that fit my schedule.
5%
10%
I could not register for all the classes I needed.
3%
9%
The time and work required to take 15 units would not allow me to participate in extracurricular activities (e.g. internship, clubs, research).
5%
7%
My financial situation prevents me from taking 15 units. (Note that taking 15 units does not cost more than 12 units in state tuition.)
2%
6%
What do these trends mean for CSU Monterey Bay and our students?
Impacts of lower unit load trends for our students:
- Lower unit loads may result in a longer time to degree for our students and at a greater cost.
- Lower unit loads may be related to lower GPAs.
- A study by the Education Advisory Board (EAB) revealed that students who completed 15 or more credit hours per term had a GPA that was .36 points higher at the end of their first year than students who averaged 12-14 credits per term.
- Lower unit loads may be related to lower retention rates.
- In the study by EAB, students who averaged 15 units per semester as freshmen were retained at rates 9% higher than students who completed fewer units.
- The same pattern of benefits to taking 15-unit loads was observed among lower-income students and across students with all levels of high school GPAs.
Impacts of lower unit load trends for CSU Monterey Bay more broadly:
- The CSU allocates funding throughout the system based on California-resident full-time equivalent students (FTES).
- Declining California resident FTES have been occurring across some CSU campuses, including CSU Monterey Bay.
- Beginning at the end of the 2023-2024 college year, which includes Summer 2023 through Spring 2024 terms, the CSU Chancellor’s Office will implement an Enrollment Target and Budget Reallocation Plan to reallocate funding from campuses that are below their FTES-funded targets and reallocate funds to campuses that are at or over their FTES funded targets.
- No realignment will occur at the end of this 2022-2023 college year, despite many campuses, including CSU Monterey Bay, being overfunded based on our California resident FTES for the college year.
- Moving forward, realignment will be based on the actual California resident FTES achieved by each campus in the college year before the realignment occurs and the thresholds where a campus will be subject to fund realignment change each year.
- For college year 2024-2025, if a campus is more than 10% below its funded California resident FTES target at the end of the 2023-2024 college year, the campus will be subject to a permanent realignment of 5% less funding.
- For college year 2025-2026, a threshold of 7% below the funded target would trigger realignment to an additional permanent 5% less funding.
- For college year 2026-2027, a threshold of 5% below the funded target would trigger realignment to an additional permanent 5% less funding.
For additional information on the enrollment declines across the CSU and the reallocation plans, see the CSU Board of Trustees Joint Committee on Educational Policy and Finance Agenda (PDF pages 4-10) from Tuesday, January 24, 2023.
How do CSU Monterey Bay trends in enrollment compare with the CSU overall and national trends?
The CSU’s Office of Institutional Research & Analyses provides Reports & Analytics Statistical Reports with various Enrollment Summaries by Fall terms or College Years that include Units Taken, Headcounts, and FTEs that can be compared across the campuses and the system overall.
The National Center for Education Statistics (NCES) provides a tool to explore undergraduate enrollment trends nationwide.
The National Student Clearinghouse Research Center also provides tools to explore national enrollment trends and estimates by various categories including by state, region, higher education sector, and various demographics.
Connect with IAR
IAR is located in Green Hall (Building 58).
Have questions about any of the analyses mentioned in this volume of IAR Insights or any of IAR’s other reports or dashboards?
Register for one of our upcoming Data Exploration Open Labs, which are held weekly.
You may also contact iar@csumb.edu for help with any of our reports or data.