Open search
Dashboard
Search
Apply
Explore
Give
Menu
Academics
Academic Affairs
Centers
Colleges
Degrees
Library
Research
Admission
First Year
Transfer
Graduate
International
Visit Campus
Campus Life
Activities
Athletics
Wellness
Housing and dining
Traditions
Resources
Academic calendar
Admin and finance
Cost calculator
Records
Reports and data
University careers
Services
Academic support
Enrollment
Financial aid
Parking and transportation
Safety
About
Accreditation
Administration
Campus
Inclusion
President
Strategic plan
Maps
News
Events
Alumni
Search
College of Health Sciences and Human Services
Section Menu
Arrow down icon
About
About CHSHS
Dean
Diversity, Equity, and Inclusion
Faculty and Staff
News
Apply
Undergraduate
Graduate
Departments
Health, Human Services, and Public Policy
Kinesiology
Nursing
Social Work
Programs
Undergraduate Degrees
Graduate Degrees
Student resources
Dean's List
Scholarships and Grants
Academic Support
Student Senator
Give
Home
College of Health Sciences and Human Services
Mission, Vision, and Guiding Principles
Fast Facts
Mission, Vision, and Guiding Principles
CHSHS Fast Facts
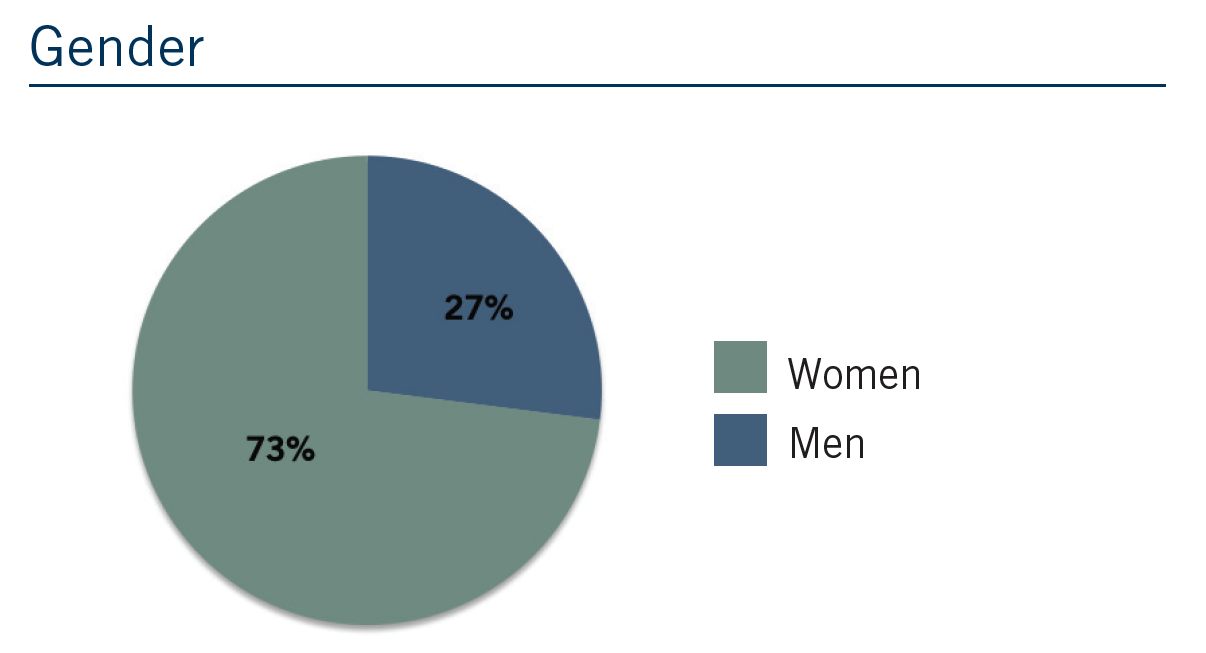
Gender
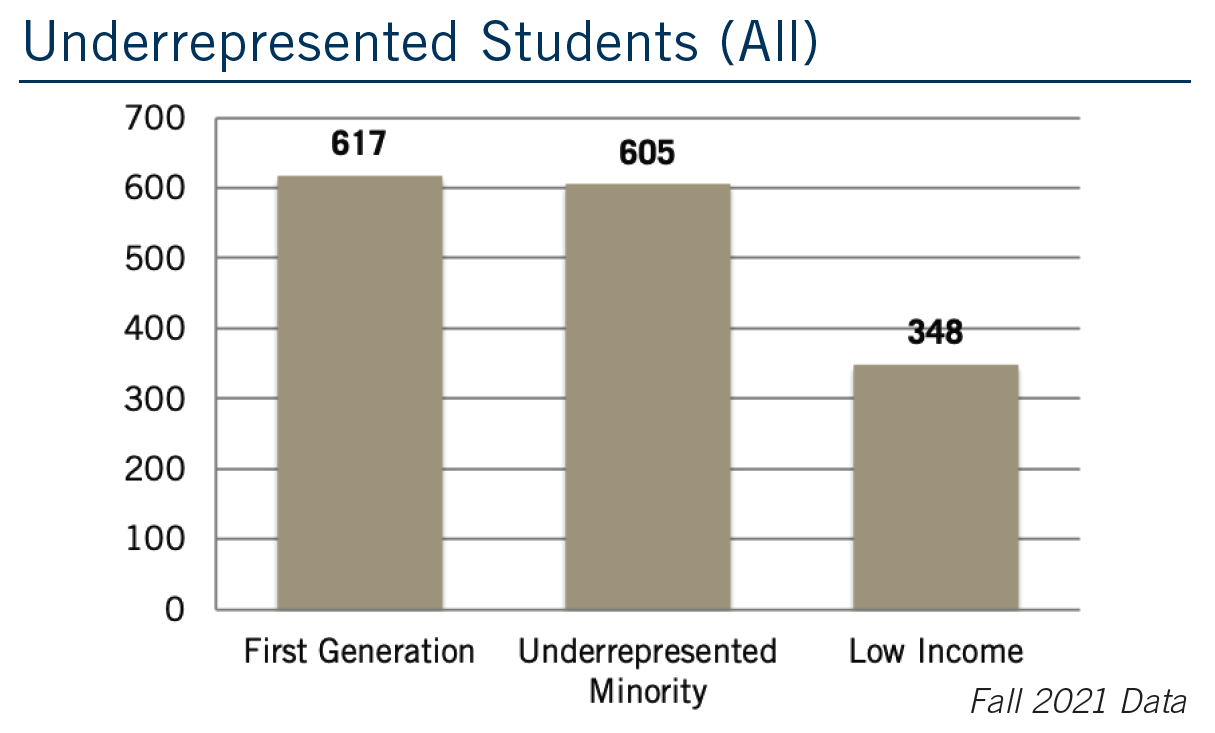
Underrepresented groups
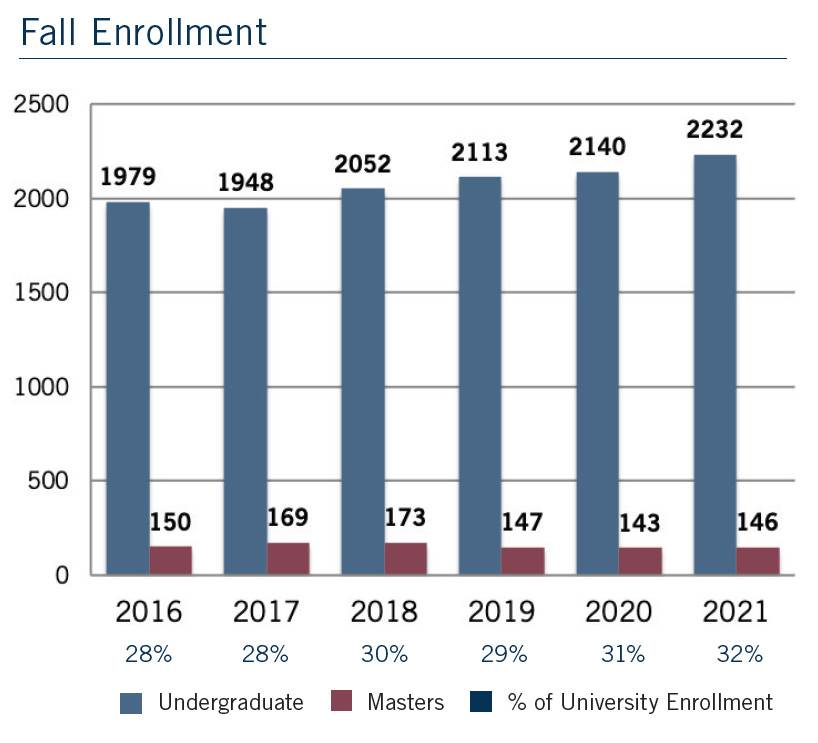
Fall enrollment
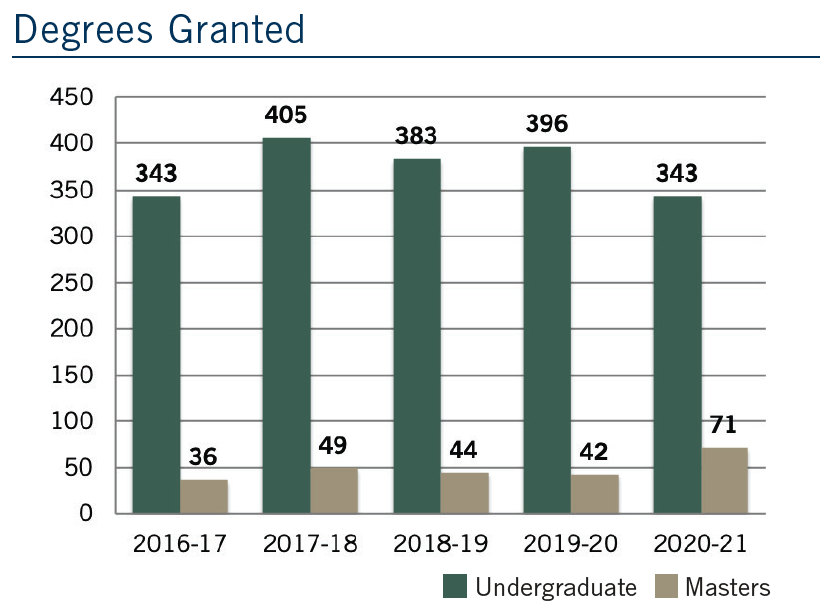
Degrees granted
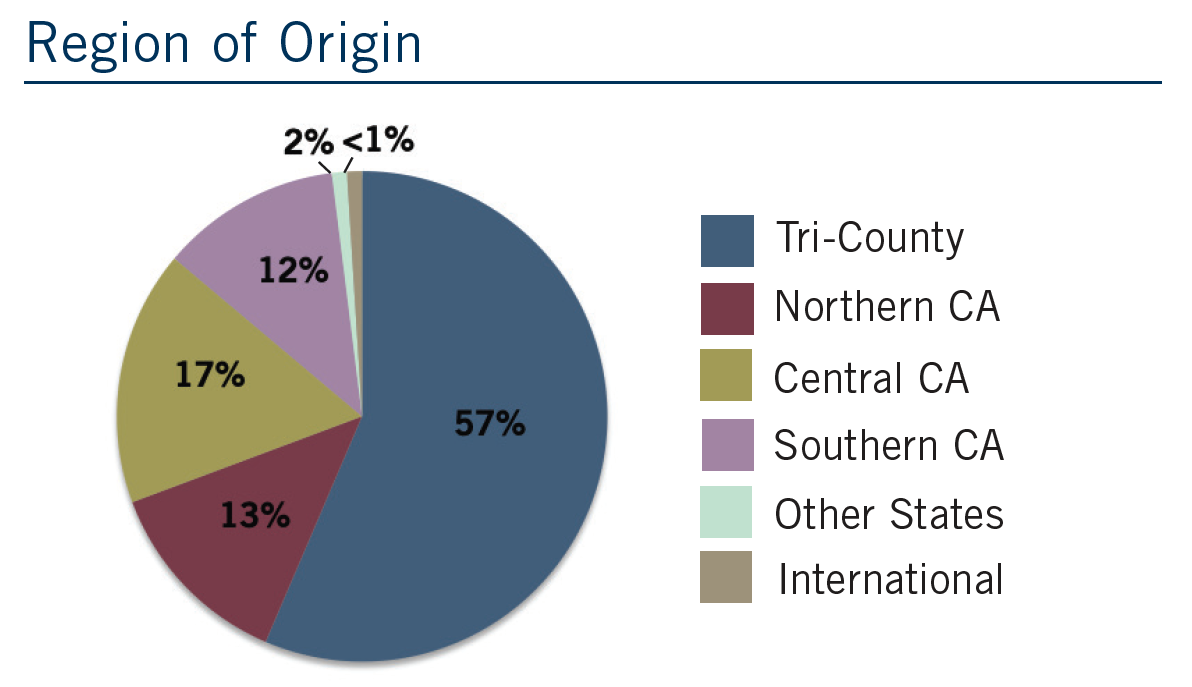
Region of origin
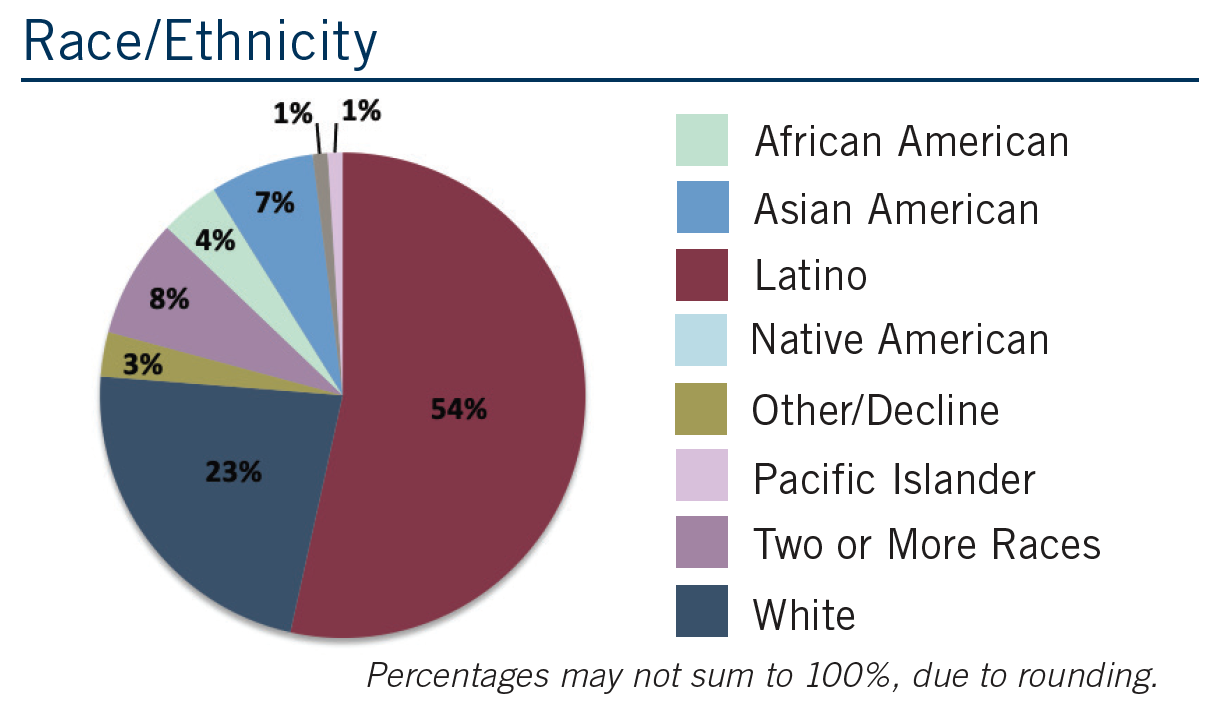
Ethnicity
Help us to improve csumb.edu
Thanks for helping us improve csumb.edu. Spot a broken link, typo, or didn't find something where you expected to? Let us know. We'll use your feedback to improve this page, and the site overall.
What you were doing *
What went wrong *
Your email address
Recaptcha response
Send Message