IAR Insights - Spring 2022

In this issue:
Exploring High DFW Courses and Course GPA Equity Gaps
- What high enrollment lower division courses have had the highest percentage of DFW grades during the past four academic years?
- What were course GPA equity gaps in the lower division courses with the highest DFW percentages?
- What high enrollment upper division courses have had the highest percentage of DFW grades during the past four academic years?
- What were course GPA equity gaps in the upper division courses with the highest DFW percentages?
- Where can you find more information about course grades and see data related to your courses or program?
Closing equity gaps in 6-year graduation rates is one of the goals of the California State University’s Graduation Initiative 2025. One of the priority areas identified to address existing equity gaps is to promote equitable learning practices and reduce DFW rates, since earning a non-passing grade negatively impacts a student’s academic trajectory and increases the risk of attrition.
This issue of IAR Insights highlights data on high-enrollment lower division and upper division courses with high percentages of students with DFW grades (grades of D+, D, D-, F, I, IC, NC, W, or WU) as aggregated over the academic years 2018-2019, 2019-2020, 2020-2021, and 2021-2022 (not including Spring 2022 grades). Equity gaps in course GPAs in these same courses aggregated across these academic years are also presented. Resources are provided to further explore these data in the CSUMB Data Warehouse and the CSU Student Success Dashboard.
What high enrollment lower division courses have had the highest percentage of DFW grades during the past four academic years?
The top lower division courses were selected where total enrollment, across all class sections, was greater than 1,000 students as aggregated across the academic years 2018-2019, 2019-2020, 2020-2021, and 2021-2022 (not including Spring 2022 grades).
Top Lower Division Courses Ranked by Students with DFW Percentage
DFW includes grades of D+, D, D-, F, I, IC, NC, W, or WU
.png)
The bubble chart below includes Students Graded along the vertical axis (courses with more students graded during the period are higher on this scale) and Students with DFW Percentage along the horizontal axis (courses with a greater percentage of students graded with DFW grades are further right on this scale). The bubble size represents the Students with DFW Count for a course (with larger bubbles having a greater count of students with DFW in the course).
DFW includes grades of D+, D, D-, F, I, IC, NC, W, or WU
.png)
Data Source: CSUMB Data Warehouse > Grades Dashboard > DFW Grades. Explore More >
How has the percentage of DFW grades in the lower division courses with the highest DFW percentages changed over the past four academic years?
Students with DFW Percentage Trend Academic Years 2018-2021 in Top Lower Division Courses Ranked by Students with DFW Percentage
DFW includes grades of D+, D, D-, F, I, IC, NC, W, or WU
.png)
Note: Academic Year 2021-2022 does not include Spring 2022 grades.
Data Source: CSUMB Data Warehouse > Grades Dashboard > DFW Grades Trends. Explore More >
What were course GPA equity gaps in the lower division courses with the highest DFW percentages?
Received Pell Aid Course GPA Equity Gaps
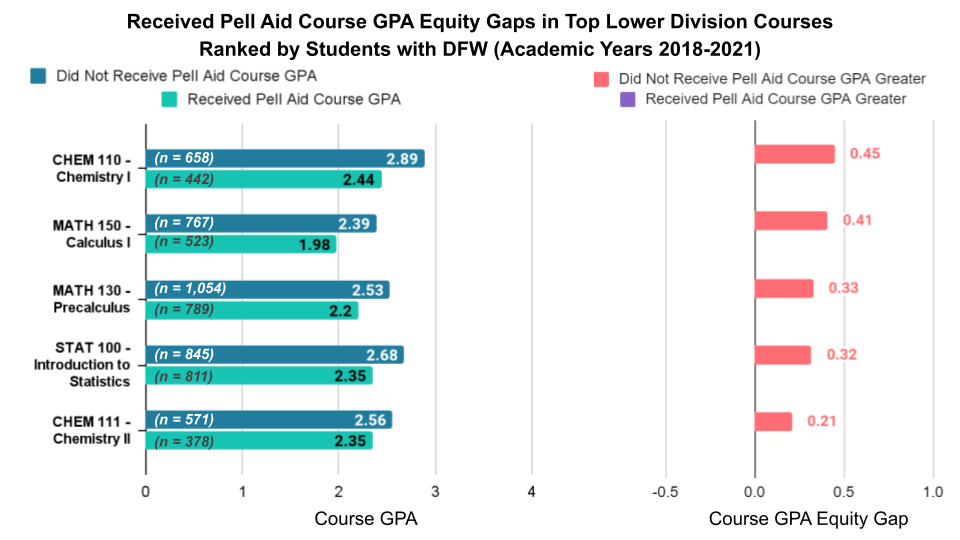
Note: Academic Year 2021-2022 does not include Spring 2022 grades.
Data Source: CSUMB Data Warehouse > Grades Dashboard > Course GPA Equity Gaps. Explore More >
Underrepresented Minority Course GPA Equity Gaps
.png)
Note: Academic Year 2021-2022 does not include Spring 2022 grades.
Data Source: CSUMB Data Warehouse > Grades Dashboard > Course GPA Equity Gaps. Explore More >
What high enrollment upper division courses have had the highest percentage of DFW grades during the past four academic years?
The top upper division courses were selected where total enrollment, across all class sections, was greater than 500 students as aggregated across the academic years 2018-2019, 2019-2020, 2020-2021, and 2021-2022 (not including Spring 2022 grades). Courses with fewer than four faculty members aggregated across these academic years were excluded.
Top Upper Division Courses Ranked by Students with DFW Percentage
DFW includes grades of D+, D, D-, F, I, IC, NC, W, or WU
.png)
The bubble chart below includes Students Graded along the vertical axis (courses with more students graded during the period are higher on this scale) and Students with DFW Percentage along the horizontal axis (courses with a greater percentage of students graded with DFW grades are further right on this scale). The bubble size represents the Students with DFW Count for a course (with larger bubbles having a greater count of students with DFW in the course).
DFW includes grades of D+, D, D-, F, I, IC, NC, W, or WU
.png)
Data Source: CSUMB Data Warehouse > Grades Dashboard > DFW Grades. Explore More >
How has the percentage of DFW grades in the upper division courses with the highest DFW percentages changed over the past four academic years?
Students with DFW Percentage Trend Academic Years 2018-2021 in Top Upper Division Courses Ranked by Students with DFW Percentage
DFW includes grades of D+, D, D-, F, I, IC, NC, W, or WU
.png)
Note: Academic Year 2021-2022 does not include Spring 2022 grades. Courses with fewer than four faculty members aggregated across the academic years displayed were excluded.
Data Source: CSUMB Data Warehouse > Grades Dashboard > DFW Grades Trends. Explore More >
What were course GPA equity gaps in the upper division courses with the highest DFW percentages?
Received Pell Aid Course GPA Equity Gaps
.png)
Note: Academic Year 2021-2022 does not include Spring 2022 grades. Courses with fewer than four faculty members aggregated across the academic years 2018-2021 were excluded.
Data Source: CSUMB Data Warehouse > Grades Dashboard > Course GPA Equity Gaps. Explore More >
Underrepresented Minority Course GPA Equity Gaps
.png)
Note: Academic Year 2021-2022 does not include Spring 2022 grades. Courses with fewer than four faculty members aggregated across the academic years 2018-2021 were excluded.
Data Source: CSUMB Data Warehouse > Grades Dashboard > Course GPA Equity Gaps. Explore More >
Where can you find more information about course grades and see data related to your courses or program?
Explore More in the CSUMB Data Warehouse
You can access the source data for each of the analyses featured in this edition of IAR Insights and explore these data more via the Guided Navigation in the CSUMB Data Warehouse.
Note: The CSUMB Data Warehouse requires access and being connected to the campus network via VPN if you are accessing from off campus. See Information Technology’s VPN page for more information on off-campus locations.
Definitions for data elements used in the analyses for this IAR Insights can be found in the CSUMB Data Glossary.
Comparative Data
Comparative data for course DFW rates and course GPA equity gaps are available on the CSU Student Success Dashboard.
- For DFW rates, see Faculty Dashboard: In Which Courses Do They Struggle or Graduation Initiative: Which Courses Have the Lowest Passage Rates?
- For course GPA equity gaps, see Graduation Initiative: Which Courses Have the Largest GPA Equity Gaps? or Equity Gaps Dashboard: Which Courses Have the Largest GPA Equity Gaps?
Connect With IAR
IAR is located in Green Hall (Building 58).
Have questions about any of the analyses mentioned in this volume of IAR Insights or any of IAR’s other reports or dashboards?
Register for one of our upcoming Data Exploration Open Labs, which are held weekly.
You may also contact iar@csumb.edu for help with any of our reports or data.