IAR Insights - Spring 2020

In this issue:
Exploring the Intersectionality of First Generation, Underrepresented Minority (URM), and Received Pell Aid Undergraduate Student Groups at CSUMB
-
What percentage of CSUMB's undergraduate students are First Generation, URM, or Received Pell Aid?
- Intersectionality of First Generation, URM, and Received Pell Aid Student Groups
- What are CSUMB's fall cohort enrollment, retention, and graduation rate trends for First-Time Freshman (FTF) and Upper Division Transfers (UDT) by intersectional groups?
- How can you access this information in the CSUMB Data Warehouse?
What percentage of CSUMB's undergraduate students are First Generation, URM, or Received Pell Aid?
Trends in undergraduate student enrollment by First Generation, URM, and Received Pell Aid
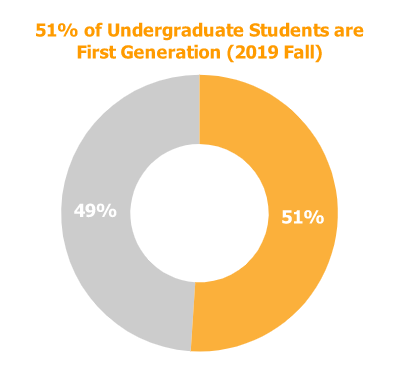
- The percentage of First Generation undergraduate students enrolled at CSUMB has fallen to 51% in 2019 Fall from 55% in 2015 Fall.
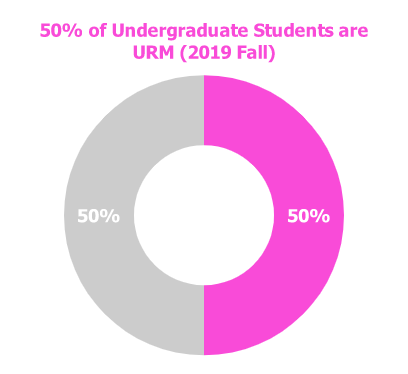
- The percentage of URM undergraduate students enrolled at CSUMB has risen to 50% in 2019 Fall from 46% in 2015 Fall.
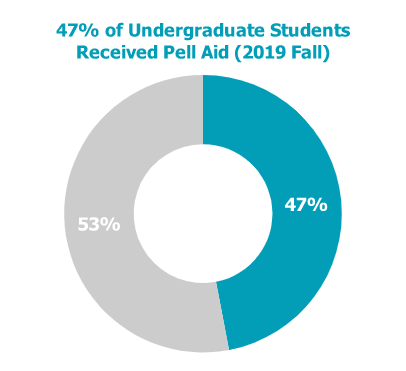
- The percentage of undergraduate students enrolled at CSUMB who Received Pell Aid has been relatively flat with 47% in 2019 Fall and 48% in 2015 Fall.
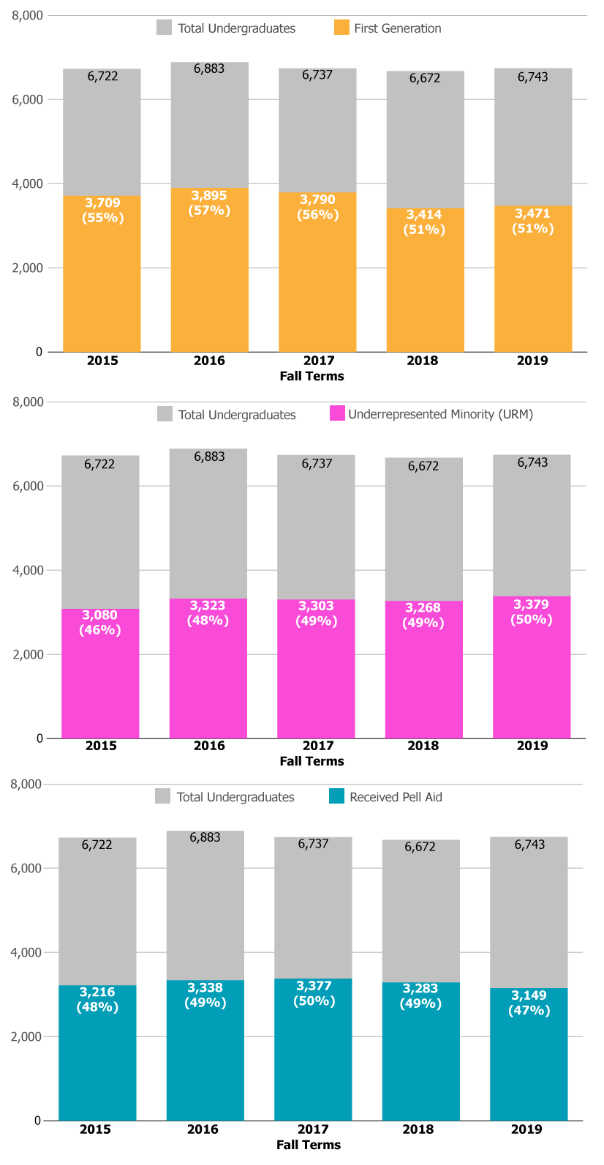
2015 Fall 2016 Fall 2017 Fall 2018 Fall 2019 Fall First Generation 3,709 (55%) 3,895 (57%) 3,790 (56%) 3,414 (51%) 3,471 (51%) URM 3,080 (46%) 3,323 (48%) 3,303 (49%) 3,268 (49%) 3,379 (50%) Received Pell Aid 3,216 (48%) 3,338 (49%) 3,377 (50%) 3,283 (49%) 3,149 (47%) Total Undergraduates 6,722 6,883 6,737 6,672 6,743
Intersectionality of First Generation, URM, and Received Pell Aid Student Groups
Rather than being mutually exclusive, individual students often are a combination of first generation, URM, and received Pell aid. If we overlay and combine these groups, we end up with seven intersectional groups in which students fall:
- First Generation Only
- URM Only
- Received Pell Aid Only
- First Generation and URM (Did Not Receive Pell Aid)
- First Generation and Received Pell Aid (Non-URM)
- URM and Received Pell Aid (Not First Generation)
- First Generation, URM, and Received Pell Aid
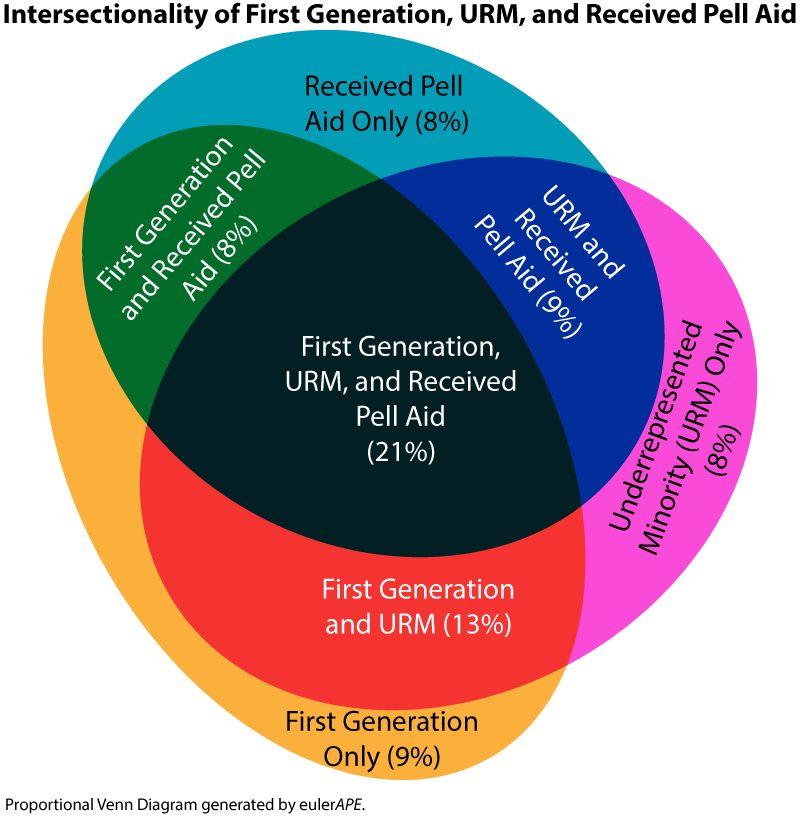
In 2019 Fall, 76% of CSUMB undergraduate students were members of one of these intersectional groups:
- 9% were First Generation only
- 8% were URM only
- 8% Received Pell Aid only
- 13% were First Generation and URM (Did Not Receive Pell Aid)
- 8% were First Generation and Received Pell Aid (Non-URM)
- 9% were URM and Received Pell Aid (Not First Generation)
- 21% were First Generation, URM, and Received Pell Aid
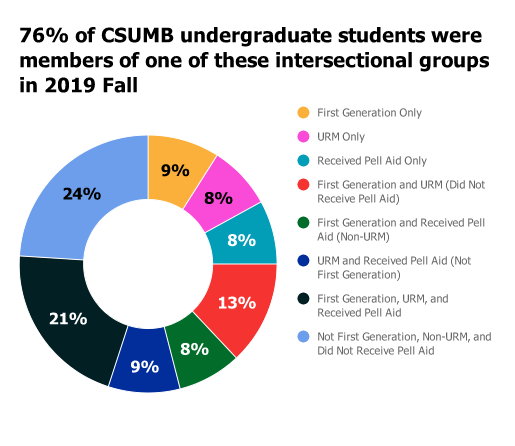
24% of CSUMB undergraduate students in 2019 Fall were Not First Generation, Non-URM, and Did Not Receive Pell Aid.
Undergraduate student enrollment trends by intersectional groups
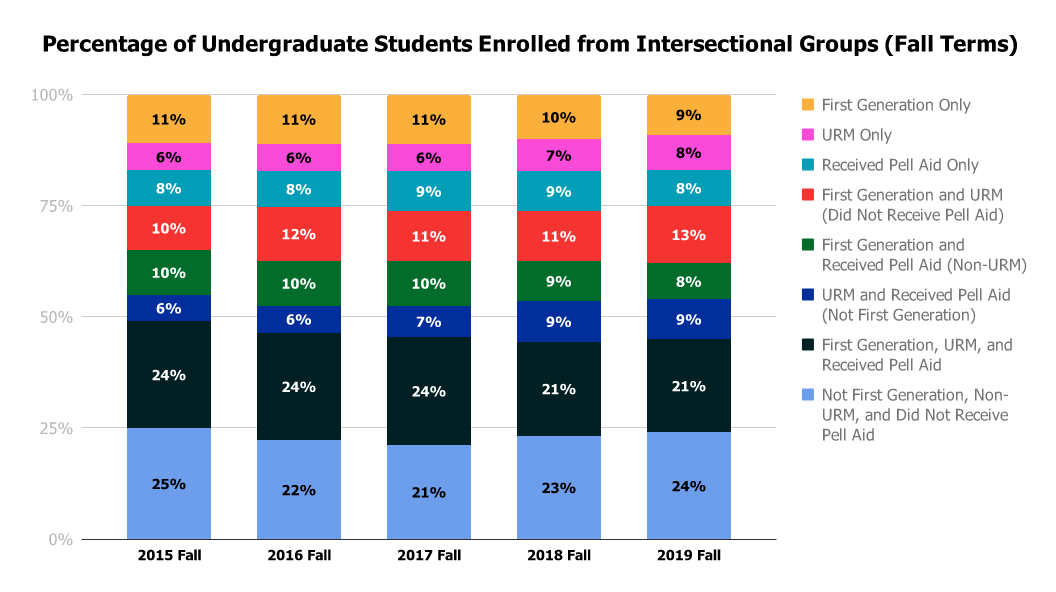
Note: Prior to 2017 Fall, approximately 1% of undergraduate students appear as "Unspecified" for First Generation Status in the CSUMB Data Warehouse. These students were included in the "Not First Generation" groups.
2015 Fall 2016 Fall 2017 Fall 2018 Fall 2019 Fall First Generation Only 729 (11%) 775 (11%) 738 (11%) 640 (10%) 631 (9%) URM Only 421 (6%) 444 (6%) 431 (6%) 488 (7%) 519 (8%) Received Pell Aid Only 538 (8%) 579 (8%) 596 (9%) 619 (9%) 571 (8%) First Generation and URM (Did Not Receive Pell Aid) 684 (10%) 799 (12%) 750 (11%) 734 (11%) 857 (13%) First Generation and Received Pell Aid (Non-URM) 703 (10%) 679 (10%) 659 (10%) 618 (9%) 575 (8%) URM and Received Pell Aid (Not First Generation) 382 (6%) 438 (6%) 479 (7%) 624 (9%) 595 (9%) First Generation, URM, and Received Pell Aid 1,593 (24%) 1,642 (24%) 1,643 (24%) 1,422 (21%) 1,408 (21%) Not First Generation, Non-URM, and Did Not Receive Pell Aid 1,672 (25%) 1,527 (22%) 1,441 (21%) 1,527 (23%) 1,587 (24%) Total Undergraduates 6,722 6,883 6,737 6,672 6,743
What are CSUMB's fall cohort enrollment, retention, and graduation rate trends for First-Time Freshman (FTF) and Upper Division Transfers (UDT) by intersectional groups?
FTF Fall Cohort Enrollment
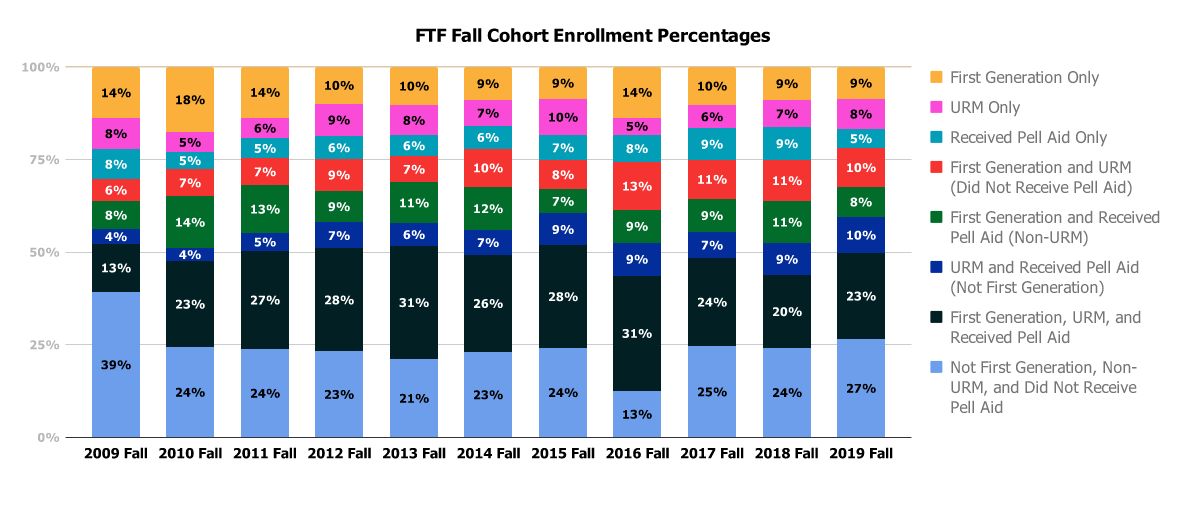
Note: Two FTF records (one in 2012 Fall and one in 2015 Fall) were “Unspecified” for First Generation status. These students were included in the "Not First Generation" groups.
FTF Fall Cohort Enrollment - 2019 Fall
2019 Fall First Generation Only 91 (8.7%) URM Only 84 (8.0%) Received Pell Aid Only 55 (5.3%) First Generation and URM (Did Not Receive Pell Aid) 108 (10.3%) First Generation and Received Pell Aid (Non-URM) 87 (8.3%) URM and Received Pell Aid (Not First Generation) 100 (9.6%) First Generation, URM, and Received Pell Aid 244 (23.3%) Not First Generation, Non-URM, and Did Not Receive Pell Aid 277 (26.5%) Total FTF 1,046 FTF Fall Cohort Enrollment - 2014 Fall to 2018 Fall
2014 Fall 2015 Fall 2016 Fall 2017 Fall 2018 Fall First Generation Only 117 (9.0%) 92 (8.7%) 110 (13.7%) 95 (10.3%) 90 (9.0%) URM Only 90 (6.9%) 102 (9.7%) 37 (4.6%) 58 (6.3%) 73 (7.3%) Received Pell Aid Only 81 (6.2%) 72 (6.8%) 60 (7.5%) 79 (8.5%) 88 (8.8%) First Generation and URM (Did Not Receive Pell Aid) 135 (10.3%) 82 (7.8%) 103 (12.8%) 97 (10.5%) 112 (11.2%) First Generation and Received Pell Aid (Non-URM) 153 (11.7%) 68 (6.5%) 71 (8.9%) 84 (9.1%) 112 (11.2%) URM and Received Pell Aid (Not First Generation) 86 (6.6%) 91 (8.7%) 71 (8.9%) 64 (6.9%) 88 (8.8%) First Generation, URM, and Received Pell Aid 343 (26.3%) 290 (27.6%) 250 (31.2%) 221 (23.9%) 195 (9.5%) Not First Generation, Non-URM, and Did Not Receive Pell Aid 300 (23.0%) 255 (24.2%) 100 (12.5%) 228 (24.6%) 242 (24.2%) Total FTF 1,305 1,052 802 926 1,000 FTF Fall Cohort Enrollment - 2009 Fall to 2013 Fall
2009 Fall 2010 Fall 2011 Fall 2012 Fall 2013 Fall First Generation Only 132 (13.9%) 147 (17.7%) 120 (13.7%) 89 (9.9%) 89 (10.3%) URM Only 78 (8.2%) 44 (5.3%) 49 (5.6%) 79 (8.8%) 71 (8.2%) Received Pell Aid Only 79 (8.3%) 38 (4.6%) 46 (5.3%) 56 (6.2%) 48 (5.5%) First Generation and URM (Did Not Receive Pell Aid) 54 (5.7%) 61 (7.4%) 64 (7.3%) 77 (8.5%) 62 (7.2%) First Generation and Received Pell Aid (Non-URM) 74 (7.8%) 115 (13.9%) 113 (12.9%) 78 (8.6%) 95 (11.0%) URM and Received Pell Aid (Not First Generation) 36 (3.8%) 30 (3.6%) 42 (4.8%) 63 (7.0%) 53 (6.1%) First Generation, URM, and Received Pell Aid 124 (13.1%) 192 (23.2%) 231 (26.5%) 251 (27.8%) 265 (30.6%) Not First Generation, Non-URM, and Did Not Receive Pell Aid 372 (39.2%) 202 (24.4%) 208 (23.8%) 209 (23.2%) 183 (21.1%) Total FTF 949 829 873 902 866
FTF 1-Year Retention
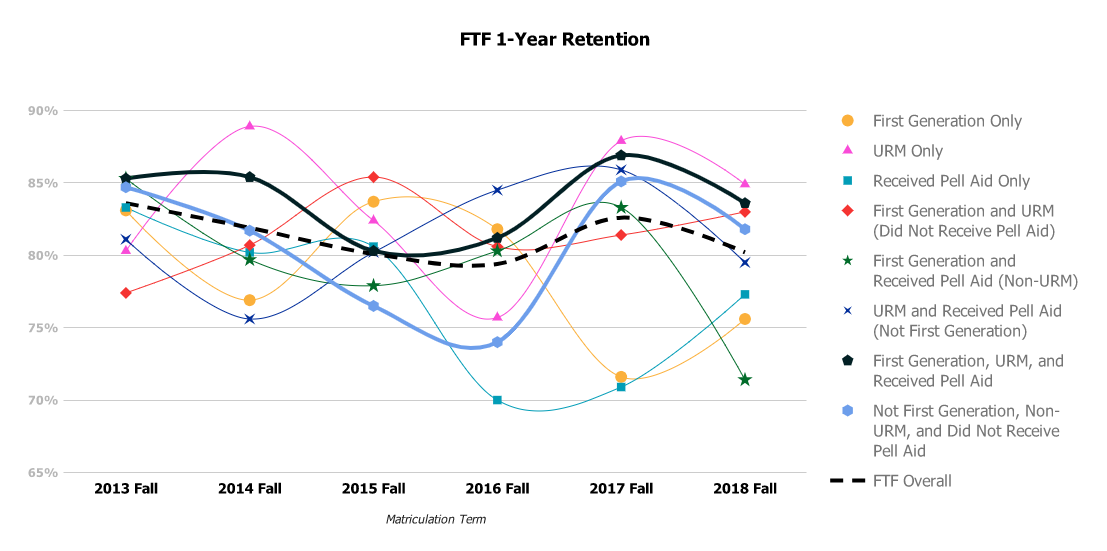
Note: One FTF record in 2015 Fall was "Unspecified" for First Generation status. This student was included in the "Not First Generation" group.
FTF 1-Year Retention - 2016 Fall to 2018 Fall
2016 Fall 2017 Fall 2018 Fall First Generation Only 81.8% (90 of 110) 71.6% (68 of 95) 75.6% (68 of 90) URM Only 75.7% (28 of 37) 87.9% (51 of 58) 84.9% (62 of 73) Received Pell Aid Only 70.0% (42 of 60) 70.9% (56 of 79) 77.3% (68 of 88) First Generation and URM (Did Not Receive Pell Aid) 80.6% (83 of 103) 81.4% (79 of 97) 83.0% (93 of 112) First Generation and Received Pell Aid (Non-URM) 80.3% (57 of 71) 83.3% (70 of 84) 71.4% (80 of 112) URM and Received Pell Aid (Not First Generation) 84.5% (60 of 71) 85.9% (55 of 64) 79.5% (70 of 88) First Generation, URM, and Received Pell Aid 81.2% (203 of 250) 86.9% (192 of 221) 83.6% (163 of 195) Not First Generation, Non-URM, and Did Not Receive Pell Aid 74.0% (74 of 100) 85.1% (194 of 228) 81.8% (198 of 242) FTF Overall 79.4% (637 of 802) 82.6% (765 of 926) 80.2% (802 of 1,000) FTF 1-Year Retention - 2013 Fall to 2015 Fall
2013 Fall 2014 Fall 2015 Fall First Generation Only 83.1% (74 of 89) 76.9% (90 of 117) 83.7% (77 of 92) URM Only 80.3% (57 of 71) 88.9% (80 of 90) 82.2% (83 of 101) Received Pell Aid Only 83.3% (40 of 48) 80.2% (65 of 81) 80.6% (58 of 72) First Generation and URM (Did Not Receive Pell Aid) 77.4% (48 of 62) 80.7% (109 of 135) 85.4% (70 of 82) First Generation and Received Pell Aid 85.3% (81 of 95) 79.7% (122 of 153) 77.9% (53 of 68) URM and Received Pell Aid (Not First Generation) 81.1% (43 of 53) 75.6% (65 of 86) 80.2% (73 of 91) First Generation, URM, and Received Pell Aid 85.3% (226 of 265) 85.4% (293 of 343) 80.3% (233 of 290) Not First Generation, Non-URM, and Did Not Receive Pell Aid 84.7% (155 of 183) 81.7% (245 of 300) 76.5% (195 of 255) FTF Overall 83.6% (724 of 866) 81.9% (1,069 of 1,305) 80.1% (843 of 1,052)
FTF 4-Year Cumulative Graduation
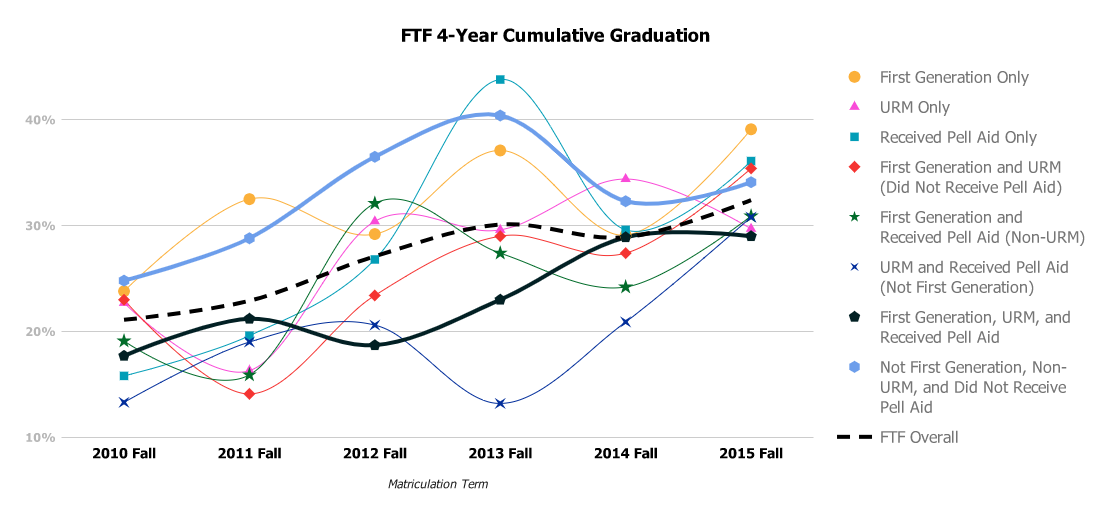
Note: Two FTF records (one in 2012 Fall and one in 2015 Fall) were "Unspecified" for First Generation status. These students were included in the FTF Overall 4-Year Cumulative Graduation rate but are not included in the rates for the intersectional groups.
FTF 4-Year Cumulative Graduation - 2013 Fall to 2015 Fall
2013 Fall 2014 Fall 2015 Fall First Generation Only 37.1% (33 of 89) 29.1% (34 of 117) 39.1% (36 of 92) URM Only 29.6% (21 of 71) 34.4% (31 of 90) 29.7% (30 of 101) Received Pell Aid 43.8% (21 of 48) 29.6% (24 of 81) 36.1% (26 of 72) First Generation and URM (Did Not Receive Pell Aid) 29.0% (18 of 62) 27.4% (37 of 135) 35.4% (29 of 82) First Generation and Received Pell Aid (Non-URM) 27.4% (26 of 95) 24.2% (37 of 153) 30.9% (21 of 68) URM and Received Pell Aid (Not First Generation) 13.2% (7 of 53) 20.9% (18 of 86) 30.8% (28 of 91) First Generation, URM, and Received Pell Aid 23.0% (61 of 265) 28.9% (99 of 343) 29.0% (84 of 290) Not First Generation, Non-URM, and Did Not Receive Pell Aid 40.4% (74 of 183) 32.3% (97 of 300) 34.1% (87 of 255) FTF Overall 30.1% (261 of 866) 28.9% (377 of 1,305) 32.4% (341 of 1,052) FTF 4-Year Cumulative Graduation - 2010 Fall to 2012 Fall
2010 Fall 2011 Fall 2012 Fall First Generation Only 23.8% (35 of 147) 32.5% (39 of 120) 29.2% (26 of 89) URM Only 22.7% (10 of 44) 16.3% (8 of 49) 30.4% (24 of 79) Received Pell Aid Only 15.8% (6 of 38) 19.6% (9 of 46) 26.8% (15 of 56) First Generation and URM (Did Not Receive Pell Aid) 23.0% (14 of 61) 14.1% (9 of 64) 23.4% (18 of 77) First Generation and Received Pell Aid (Non-URM) 19.1% (22 of 115) 15.9% (18 of 113) 32.1% (25 of 78) URM and Received Pell Aid (Not First Generation) 13.3% (4 of 30) 19.0% (8 of 42) 20.6% (13 of 63) First Generation, URM, and Received Pell Aid 17.7% (34 of 192) 21.2% (49 of 231) 18.7% (47 of 251) Not First Generation, Non-URM, and Did Not Receive Pell Aid 24.8% (50 of 202) 28.8% (60 of 208) 36.5% (76 of 208) FTF Overall 21.1% (175 of 829) 22.9% (200 of 873) 27.1% (244 of 902)
FTF 6-Year Cumulative Graduation
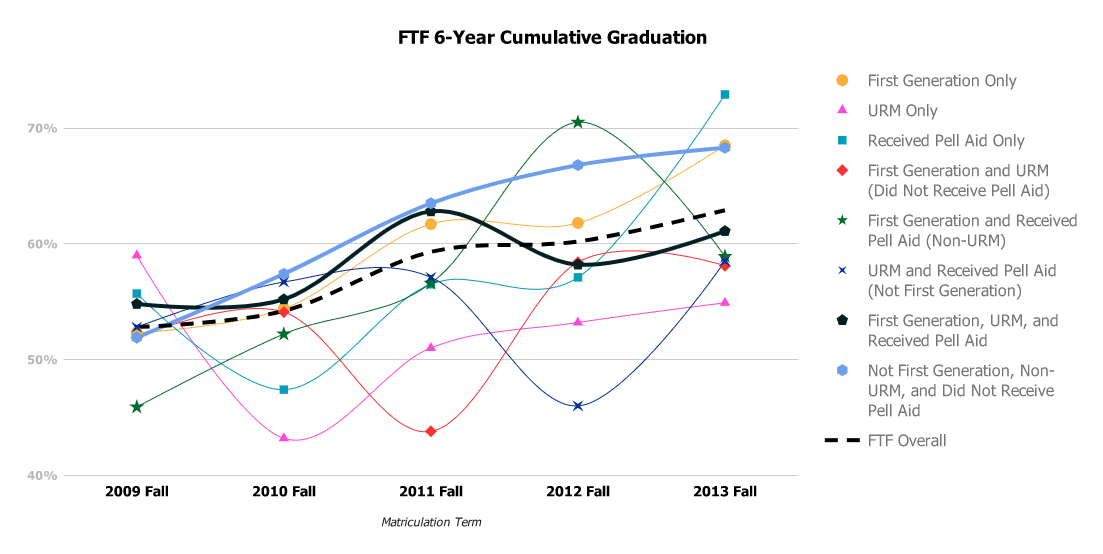
Note: One FTF record in 2012 Fall was "Unspecified" for First Generation status. This student was included in the FTF Overall 6-Year Cumulative Graduation rate but is not included in the rates for the intersectional groups.
2009 Fall 2010 Fall 2011 Fall 2012 Fall 2013 Fall First Generation Only 52.3% (69 of 13) 54.4% (80 of 147) 61.7% (74 of 120) 61.8% (55 of 89) 68.5% (61 of 89) URM Only 59.0% (46 of 78) 43.2% (19 of 44) 51.0% (25 of 49) 53.2% (42 of 79) 54.9% (39 of 71) Received Pell Aid Only 55.7% (44 of 79) 47.4% (18 of 38) 56.5% (26 of 46) 57.1% (32 of 56) 72.9% (35 of 48) First Generation and URM (Did Not Receive Pell Aid) 51.9% (28 of 54) 54.1% (33 of 61) 43.8% (28 of 64) 58.4% (45 of 77) 58.1% (36 of 62) First Generation and Received Pell Aid (Non-URM) 45.9% (34 of 74) 52.2% (60 of 115) 56.6% (64 of 113) 70.5% (55 of 78) 58.9% (56 of 95) URM and Received Pell Aid (Not First Generation) 52.8% (19 of 36) 56.7% (17 of 30) 57.1% (24 of 42) 46.0% (29 of 63) 58.5% (31 of 53) First Generation, URM, and Received Pell Aid 54.8% (68 of 124) 55.2% (106 of 192) 62.8% (145 of 231) 58.2% (146 of 251) 61.1% (162 of 265) Not First Generation, Non-URM, and Did Not Receive Pell Aid 51.9% (193 of 372) 57.4% (116 of 202) 63.5% (132 of 208) 66.8% (139 of 208) 68.3% (125 of 183) FTF Overall 52.8% (501 of 949) 54.2% (449 of 829) 59.3% (518 of 873) 60.2% (543 of 902) 62.9% (545 of 866)
UDT Fall Cohort Enrollment
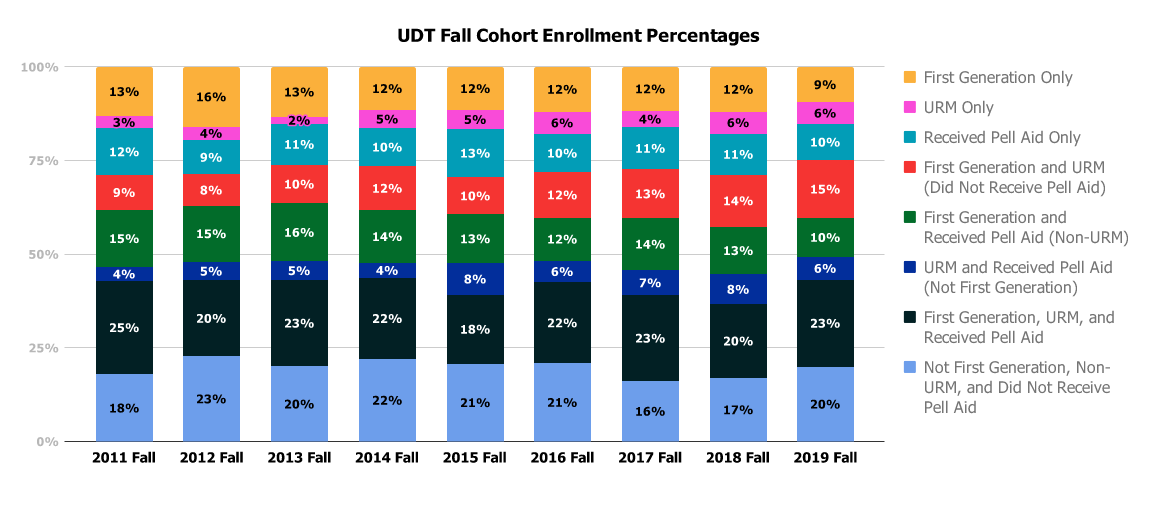
Note: Three UDT records (one in 2012 Fall and two in 2013 Fall) were "Unspecified" for First Generation status. These students were included in the "Not First Generation" groups.
UDT Fall Cohort Enrollment - 2016 Fall to 2019 Fall
2016 Fall 2017 Fall 2018 Fall 2019 Fall First Generation Only 112 (11.9%) 100 (11.7%) 110 (11.9%) 99 (9.4%) URM Only 57 (6.0%) 38 (4.4%) 55 (5.9%) 61 (5.8%) Received Pell Aid Only 96 (10.2%) 96 (11.2%) 102 (11.0%) 102 (9.7%) First Generation and URM (Did Not Receive Pell Aid) 114 (12.1%) 112 (13.1%) 128 (13.8%) 162 (15.4%) First Generation and Received Pell Aid (Non-URM) 109 (11.5%) 118 (13.8%) 118 (12.8%) 110 (10.4%) URM and Received Pell Aid (Not First Generation) 55 (5.8%) 58 (6.8%) 73 (7.9%) 64 (6.1%) First Generation, URM, and Received Pell Aid 204 (21.6%) 195 (22.8%) 182 (19.7%) 244 (23.2%) Not First Generation, Non-URM, and Did Not Receive Pell Aid 197 (20.9%) 139 (16.2%) 157 (17.0%) 211 (20.0%) Total UDT 944 856 925 1,053 UDT Fall Cohort Enrollment - 2011 Fall to 2015 Fall
2011 Fall 2012 Fall 2013 Fall 2014 Fall 2015 Fall First Generation Only 72 (13.1%) 105 (15.9%) 100 (13.3%) 104 (11.5%) 94 (11.5%) URM Only 18 (3.3%) 24 (3.6%) 14 (1.8%) 43 (4.8%) 41 (5.0%) Received Pell Aid Only 68 (12.4%) 61 (9.2%) 83 (11.0%) 92 (10.2%) 106 (13.0%) First Generation and URM (Did Not Receive Pell Aid) 51 (9.3%) 55 (8.3%) 77 (10.2%) 106 (11.8%) 80 (9.8%) First Generation and Received Pell Aid (Non-URM) 84 (15.3%) 99 (15.0%) 117 (15.5%) 126 (14.0%) 107 (13.1%) URM and Received Pell Aid (Not First Generation) 20 (3.6%) 33 (5.0%) 37 (4.9%) 37 (4.1%) 69 (8.4%) First Generation, URM, and Received Pell Aid 137 (25.0%) 134 (20.2%) 174 (23.1%) 195 (21.6%) 150 (18.4%) Not First Generation, Non-URM, and Did Not Receive Pell Aid 98 (17.9%) 151 (22.8%) 151 (20.0%) 199 (22.1%) 170 (20.8%) Total UDT 548 662 753 902 817
UDT 1-Year Retention
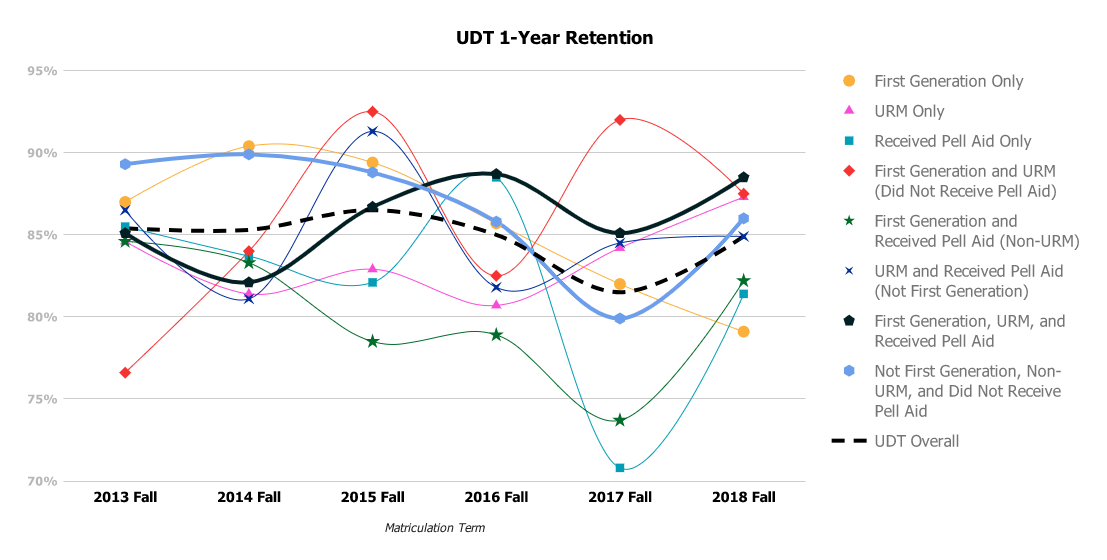
Note: Two UDT records were "Unspecified" for First Generation status in 2013 Fall. These students are included in the UDT Overall 1-Year Retention rate but not in the rates for the intersectional groups.
UDT 1-Year Retention - 2016 Fall to 2018 Fall
2016 Fall 2017 Fall 2018 Fall First Generation Only 85.7% (96 of 112) 82.0% (82 of 100) 79.1% (87 of 110) URM Only 80.7% (46 of 57) 84.2% (32 of 38) 87.3% (48 of 55) Received Pell Aid Only 88.5% (85 of 96) 70.8% (68 of 96) 81.4% (83 of 102) First Generation and URM (Did Not Receive Pell Aid) 82.5% (94 of 114) 92.0% (103 of 112) 87.5% (112 of 128) First Generation and Received Pell Aid (Non-URM) 78.9% (86 of 109) 73.7% (87 of 118) 82.2% (97 of 118) URM and Received Pell Aid (Not First Generation) 81.8% (45 of 55) 84.5% (49 of 58) 84.9% (62 of 73) First Generation, URM, and Received Pell Aid 88.7% (181 of 204) 85.1% (166 of 195) 88.5% (166 of 182) Not First Generation, Non-URM, and Did Not Receive Pell Aid 85.8% (169 of 197) 79.9% (111 of 139) 86.0% (135 of 157) UDT Overall 85.0% (802 of 944) 81.5% (698 of 856) 84.9% (785 of 925) UDT 1-Year Retention - 2013 Fall to 2015 Fall
2013 Fall 2014 Fall 2015 Fall First Generation Only 87.0% (87 of 100) 90.4% (94 of 104) 89.4% (84 of 94) URM Only 84.6% (11 of 13) 81.4% (35 of 43) 82.9% (34 of 41) Received Pell Aid Only 85.5% (71 of 83) 83.7% (77 of 92) 82.1% (87 of 106) First Generation and URM (Did Not Receive Pell Aid) 76.6% (59 of 77) 84.0% (89 of 106) 92.5% (74 of 80) First Generation and Received Pell Aid (Non-URM) 84.6% (99 of 117) 83.3% (105 of 126) 78.5% (84 of 107) URM and Received Pell Aid (Not First Generation) 86.5% (32 of 37) 81.1% (30 of 37) 91.3% (63 of 69) First Generation, URM, and Received Pell Aid 85.1% (148 of 174) 82.1% (160 of 195) 86.7% (130 of 150) Not First Generation, Non-URM, and Did Not Receive Pell Aid 89.3% (134 of 150) 89.9% (179 of 199) 88.8% (151 of 170) UDT Overall 85.4% (642 of 752) 85.3% (769 of 902) 86.5% (707 of 817)
UDT 2-Year Cumulative Graduation
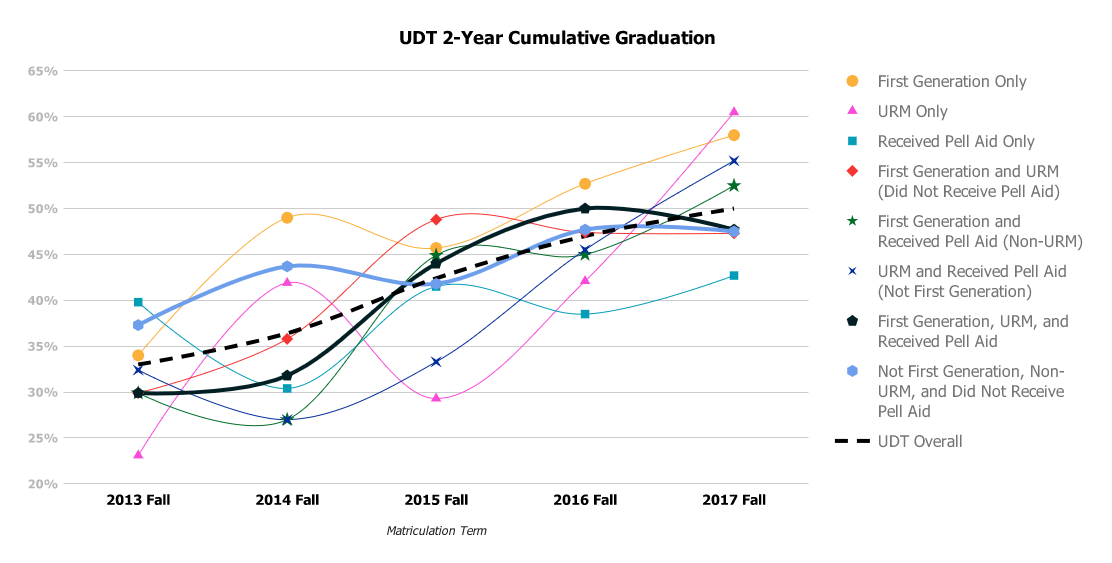
Note: Two UDT records in 2013 Fall were "Unspecified" for First Generation status. These students are included in the UDT Overall 2-Year Cumulative Graduation rate but not in the rates for the intersectional groups.
UDT 2-Year Cumulative Graduation - 2013 Fall to 2017 Fall
2013 Fall 2014 Fall 2015 Fall 2016 Fall 2017 Fall First Generation Only 34.0% (34 of 100) 49.0% (51 of 104) 45.7% (43 of 94) 52.7% (59 of 112) 58.0% (58 of 100) URM Only 23.1% (3 of 13) 41.9% (18 of 43) 29.3% (12 of 41) 42.1% (24 of 57) 60.5% (23 of 38) Received Pell Aid Only 39.8% (33 of 83) 30.4% (28 of 92) 41.5% (44 of 106) 38.5% (37 of 96) 42.7% (41 of 96) First Generation and URM (Did Not Receive Pell Aid) 29.9% (23 of 77) 35.8% (38 of 106) 48.8% (39 of 80) 47.4% (54 of 114) 47.3% (53 of 112) First Generation and Received Pell Aid (Non-URM) 29.9% (35 of 117) 27.0% (34 of 126) 44.9% (48 of 107) 45.0% (49 of 109) 52.5% (62 of 118) URM and Received Pell Aid (Not First Generation) 32.4% (12 of 37) 27.0% (10 of 37) 33.3% (23 of 69) 45.5% (25 of 55) 55.2% (32 of 58) First Generation, URM, and Received Pell Aid 29.9% (52 of 174) 31.8% (62 of 195) 44.0% (66 of 150) 50.0% (102 of 204) 47.7% (93 of 195) Not First Generation, Non-URM, and Did Not Receive Pell Aid 37.3% (56 of 150) 43.7% (87 of 199) 41.8% (71 of 170) 47.7% (94 of 197) 47.5% (66 of 139) UDT Overall 33.0% (248 of 752) 36.4% (328 of 902) 42.4% (346 of 817) 47.0% (444 of 944) 50.0% (428 of 856)
UDT 4-Year Cumulative Graduation
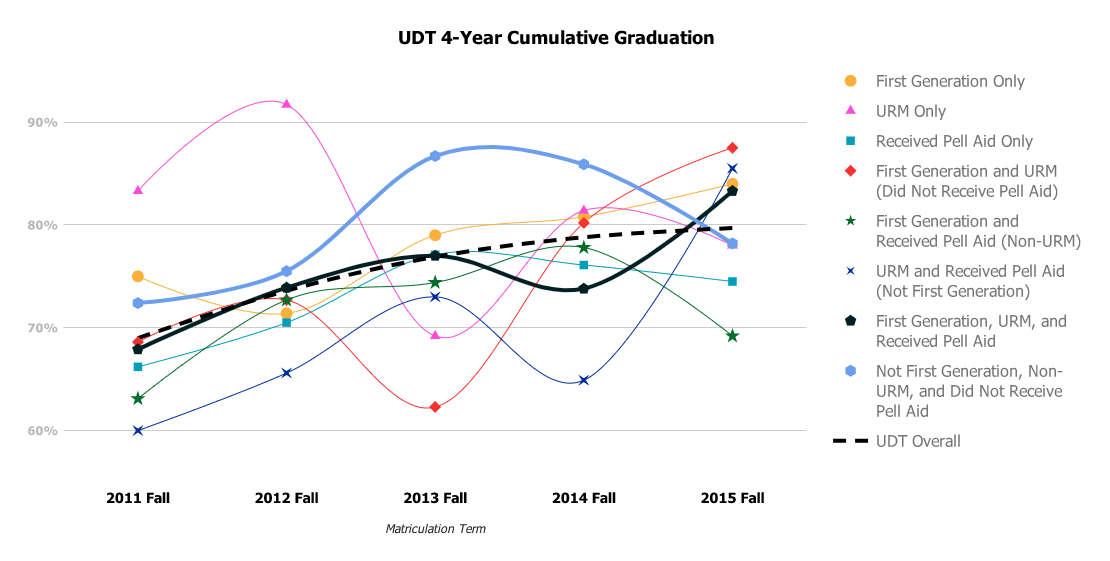
Note: Three UDT records (one in 2012 Fall and two in 2013 Fall) were "Unspecified" for First Generation status. These students are included in the UDT Overall 4-Year Cumulative Graduation rate but not in the rates for the intersectional groups.
UDT 4-Year Cumulative Graduation - 2011 Fall to 2015 Fall
2011 Fall 2012 Fall 2013 Fall 2014 Fall 2015 Fall First Generation Only 75.0% (54 of 72) 71.4% (75 of 105) 79.0% (79 of 100) 80.8% (84 of 104) 84.0% (79 of 94) URM Only 83.3% (15 of 18) 91.7% (22 of 24) 69.2% (9 of 13) 81.4% (35 of 43) 78.0% (32 of 41) Received Pell Aid Only 66.2% (45 of 68) 70.5% (43 of 61) 77.1% (64 of 83) 76.1% (70 of 92) 74.5% (79 of 106) First Generation and URM (Did Not Receive Pell Aid) 68.6% (35 of 51) 72.7% (40 of 55) 62.3% (48 of 77) 80.2% (85 of 106) 87.5% (70 of 80) First Generation and Received Pell Aid (Non-URM) 63.1% (53 of 84) 72.7% (72 of 99) 74.4% (87 of 117) 77.8% (98 of 126) 69.2% (74 of 107) URM and Received Pell Aid (Not First Generation) 60.0% (12 of 20) 65.6% (21 of 32) 73.0% (27 of 37) 64.9% (24 of 37) 85.5% (59 of 69) First Generation, URM, and Received Pell Aid 67.9% (93 of 137) 73.9% (99 of 134) 77.0% (134 of 174) 73.8% (144 of 195) 83.3% (125 of 150) Not First Generation, Non-URM, and Did Not Receive Pell Aid 72.4% (71 of 98) 75.5% (114 of 151) 86.7% (130 of 150) 85.9% (171 of 199) 78.2% (133 of 170) UDT Overall 69.0% (378 of 548) 73.6% (487 of 662) 76.9% (578 of 752) 78.8% (711 of 902) 79.7% (651 of 817)
How can you access this information in the CSUMB Data Warehouse?
You can access this information in the CSUMB Data Warehouse and break it down or filter further by college, major, support programs, or other student characteristics.
Enrollment data can be cross tabulated using the Enrollment (Census) Dashboard’s Multilevel Crosstab Table tab, selecting “First Generation,” “Underrepresented Minority Description,” and “Received Pell Aid” as Group Breakdowns, and filtering by Student Type of “Undergraduate.”
The retention and graduation data can be cross tabulated using the Retention and Graduation Dashboard’s Multilevel Crosstab Table tab, selecting “First Generation,” “Underrepresented Minority Description,” and “Received Pell Aid” as Group Breakdowns, and filtering by Cohort Type of “First-Time Freshman (FTF)” or Cohort Type of “Upper Division Transfer.”
Connect with IAR
IAR is located in Green Hall (Building 58). Come by and see us!
Have questions about any of the analyses mentioned in this volume of IAR Insights or any of IAR's other reports or dashboards?
- Register for one of our upcoming Data Exploration Open Labs, which are held twice per month.
You can also contact us for help with any of our reports or data.
Proportional Venn Diagram was created using eulerAPE.
Luana Micallef and Peter Rodgers (2014). eulerAPE: Drawing Area-proportional 3-Venn Diagrams Using Ellipses.PLoS ONE 9(7): e101717. doi:10.1371/journal.pone.0101717. http://www.eulerdiagrams.org/eulerAPE.