IAR Insights - Spring 2019

In this issue:
Undergraduate Graduation Rates at CSUMB
Introduction
This issue of IAR Insights focuses on First-Time Freshman (FTF) and Upper Division Transfer (UDT) cumulative graduation rates and provides breakdowns on these rates for key student groups of interest: underrepresented minorities (URM), those that received Pell aid at matriculation, and those from the tri-county region. Cumulative graduation rates reported come from the Retention and Graduation dashboard in the CSUMB Data Warehouse (not from the Graduation Initiative 2025 dashboard, which uses different cohort definitions). You can use the Retention and Graduation dashboard to see graduation data on many additional group breakdowns than those provided here. To learn more, see How Can You Learn About CSUMB's Graduation Rates and Find Data for Students in Your College or Program?
What Are CSUMB's First-Time Freshman (FTF) Graduation Rates?
Overall FTF Graduation Rates
Source: CSUMB Data Warehouse - Retention and Graduation Dashboard
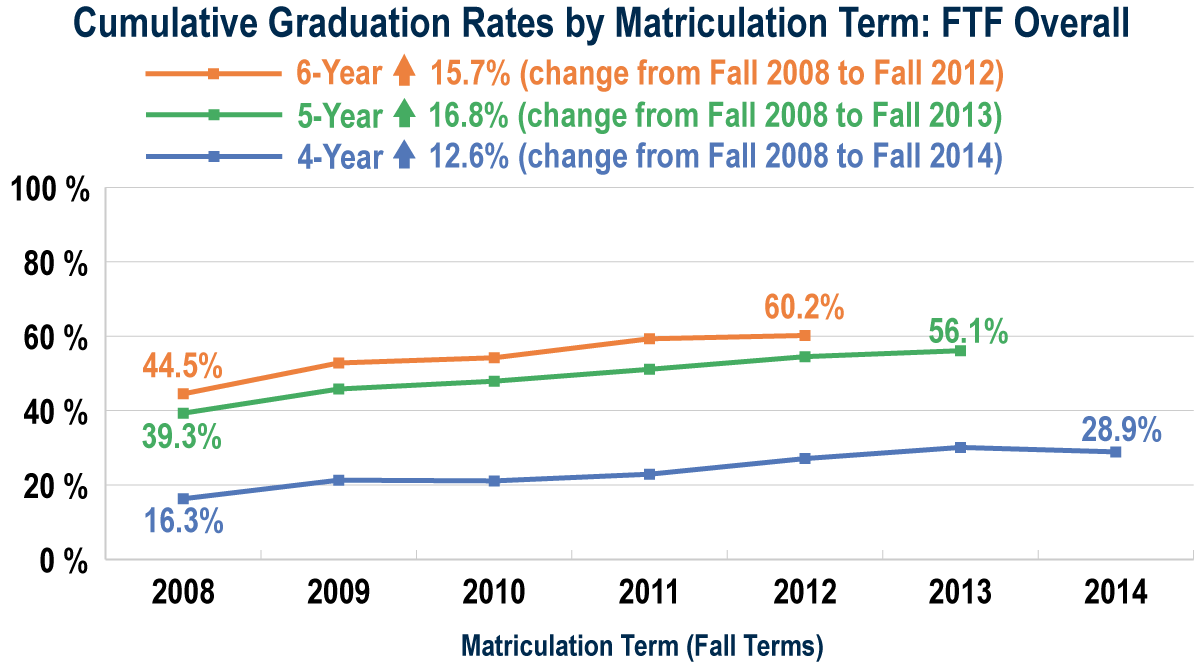
- CSUMB’s 4-year, 5-year, and 6-year cumulative graduation rates for FTF students overall have all increased from the Fall 2008 matriculation term.
FTF 4-year cumulative graduation rates have increased from 16.3% for the Fall 2008 entering cohort to 28.9% for the Fall 2014 entering cohort, an increase of 12.6%. FTF 5-year cumulative graduation rates have increased from 39.3% for the Fall 2008 entering cohort to 56.1% for the Fall 2013 entering cohort, an increase of 16.8%. FTF 6-year cumulative graduation rates have increased from 44.5% for the Fall 2008 entering cohort to 60.2% for the Fall 2012 entering cohort, an increase of 15.7%.
Matriculation Term FTF 4-Year Cumulative Graduation FTF 5-Year Cumulative Graduation FTF 6-Year Cumulative Graduation Fall 2008 16.3% 39.3% 44.5% Fall 2009 21.3% 45.8% 52.8% Fall 2010 21.1% 47.9% 54.2% Fall 2011 22.9% 51.1% 59.3% Fall 2012 27.1% 54.5% 60.2% Fall 2013 30.1% 56.1% Fall 2014 28.9%
Underrepresented Minority (URM) vs. Non-URM FTF Graduation Rates
Source: CSUMB Data Warehouse - Retention and Graduation Dashboard
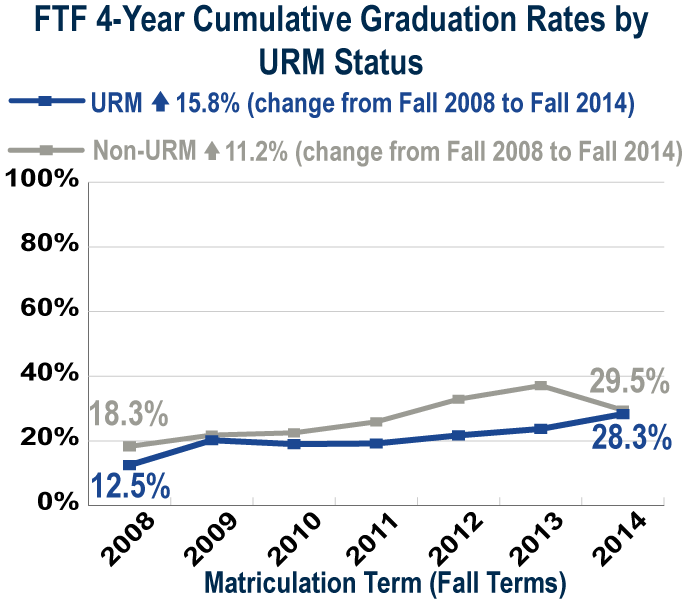
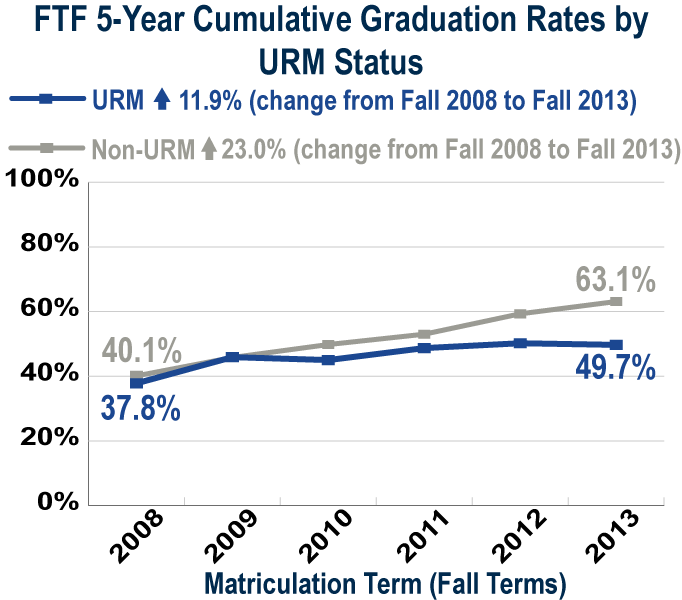
- CSUMB’s 4-year, 5-year, and 6-year cumulative graduation rates for URM FTF students have risen from the Fall 2008 matriculation term but at a generally smaller magnitude than the increase in cumulative graduation rates for Non-URM FTF students.
Underrepresented minority (URM) students include race / ethnicity groups that have traditionally been underrepresented in higher education--African American, Latino, and Native American. Non-URM students include all other race / ethnicity groups. Just over half (51%) of all entering FTF, over the last five years, are URM students.
While the 4-year, 5-year, and 6-year cumulative graduation rates for both URM and non-URM FTF have risen since Fall 2008, the 5-year and 6-year cumulative graduation rates of non-URM FTF have risen at a greater magnitude than those of URM FTF while the 4-year cumulative graduation rates of URM FTF rose at a greater magnitude than those of non-URM FTF. The 4-year cumulative graduation rates for non-URM FTF rose from 18.3% for the Fall 2008 entering cohort to 29.5% for the Fall 2014 entering cohort, an increase of 11.2%. The 4-year cumulative graduation rates for URM FTF rose from 12.5% to 28.3% for the same period, an increase of 15.8%. The 5-year cumulative graduation rates for non-URM FTF rose from 40.1% for the Fall 2008 entering cohort to 63.1% for the Fall 2013 entering cohort, an increase of 23.0%. The 5-year cumulative graduation rates for URM FTF rose from 37.8% to 49.7% for the same period, an increase of 11.9%. The 6-year cumulative graduation rates for non-URM FTF rose from 44.8% for the Fall 2008 entering cohort to 65.0% for the Fall 2012 entering cohort, an increase of 20.2%. The 6-year cumulative graduation rates for URM FTF rose from 43.9% to 55.7% for the same period, an increase of 11.8%.
Matriculation Term URM Status FTF 4-Year Cumulative Graduation FTF 5-Year Cumulative Graduation FTF 6-Year Cumulative Graduation Fall 2008 URM 12.5% 37.8% 43.9% Fall 2008 Non-URM 18.3% 40.1% 44.8% Fall 2009 URM 20.2% 45.9% 55.1% Fall 2009 Non-URM 21.8% 45.8% 51.8% Fall 2010 URM 19.0% 45.0% 53.5% Fall 2010 Non-URM 22.5% 49.8% 54.6% Fall 2011 URM 19.2% 48.7% 57.5% Fall 2011 Non-URM 25.9% 53.0% 60.8% Fall 2012 URM 21.7% 50.2% 55.7% Fall 2012 Non-URM 32.9% 59.3% 65.0% Fall 2013 URM 23.7% 49.7% Fall 2013 Non-URM 37.1% 63.1% Fall 2014 URM 28.3% Fall 2014 Non-URM 29.5%
Received Pell Aid vs. Did Not Receive Pell Aid FTF Graduation Rates
Source: CSUMB Data Warehouse - Retention and Graduation Dashboard
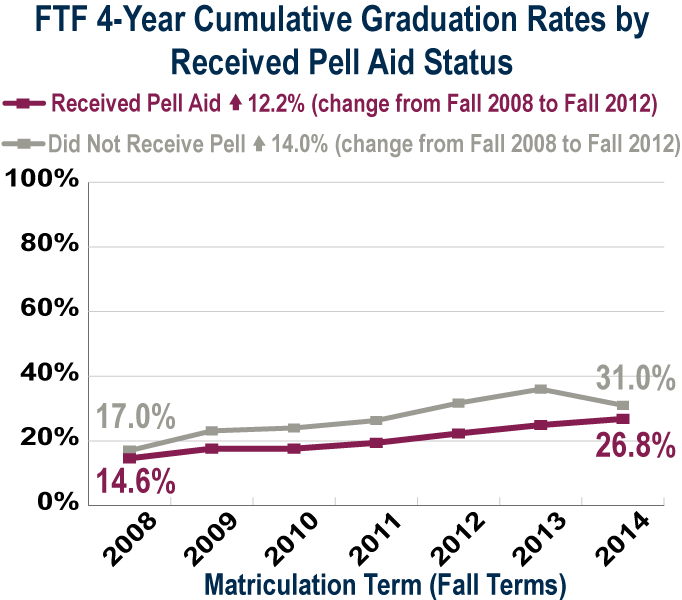
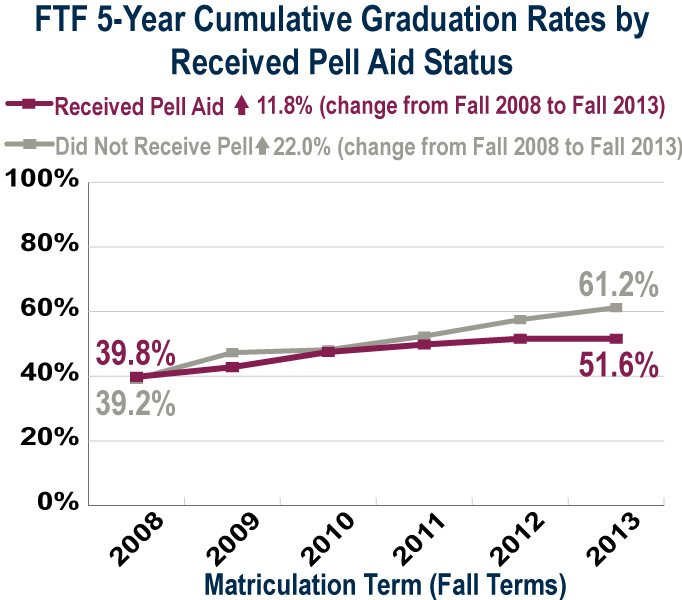
- CSUMB’s 4-year, 5-year, and 6-year cumulative graduation rates for FTF students that received Pell aid have all risen since the Fall 2008 matriculation term but at a lesser magnitude than the rates for FTF students that did not receive Pell aid.
Over the previous five years, approximately 51% of entering FTF students have received Pell aid at matriculation. The 4-year, 5-year, and 6-year cumulative graduation rates of FTF that have received Pell aid at matriculation and those that did not receive Pell aid at matriculation have risen for both groups, but at a lesser magnitude for FTF that received Pell aid at matriculation.
The 4-year cumulative graduation rates of FTF that received Pell aid at matriculation increased from 14.6% for the Fall 2008 entering cohort to 26.8% for the Fall 2014 entering cohort, an increase of 12.2%. For FTF that did not receive Pell aid at matriculation, the 4-year cumulative graduation rates increased from 17.0% to 31.0% for the same period, an increase of 14.0%. The 5-year cumulative graduation rates of FTF that received Pell aid at matriculation increased from 39.8% for the Fall 2008 entering cohort to 51.6% for the Fall 2013 entering cohort, an increase of 11.8%. For FTF that did not receive Pell aid at matriculation, the 5-year cumulative graduation rates increased from 39.2% to 61.2% for the same period, an increase of 22.0%. The 6-year cumulative graduation rates of FTF that received Pell aid at matriculation increased from 46.1% for the Fall 2008 entering cohort to 58.5% for the Fall 2012 entering cohort, an increase of 12.4%. For FTF that did not receive Pell aid at matriculation, the 6-year cumulative graduation rates increased from 43.9% to 61.9% for the same period, an increase of 18.0%.
Matriculation Term Received Pell Aid Status FTF 4-Year Cumulative Graduation FTF 5-Year Cumulative Graduation FTF 6-Year Cumulative Graduation Fall 2008 Received Pell Aid 14.6% 39.8% 46.1% Fall 2008 Did Not Receive Pell Aid 17.0% 39.2% 43.9% Fall 2009 Received Pell Aid 17.6% 42.8% 52.7% Fall 2009 Did Not Receive Pell Aid 23.1% 47.3% 52.8% Fall 2010 Received Pell Aid 17.6% 47.5% 53.6% Fall 2010 Did Not Receive Pell Aid 24.0% 48.2% 54.6% Fall 2011 Received Pell Aid 19.4% 49.8% 60.0% Fall 2011 Did Not Receive Pell Aid 26.3% 52.4% 58.7% Fall 2012 Received Pell Aid 22.3% 51.6% 58.5% Fall 2012 Did Not Receive Pell Aid 31.7% 57.5% 61.9% Fall 2013 Received Pell Aid 24.9% 51.6% Fall 2013 Did Not Receive Pell Aid 36.0% 61.2% Fall 2014 Received Pell Aid 26.8% Fall 2014 Did Not Receive Pell Aid 31.0%
Tri-County vs. Other Region FTF Graduation Rates
Source: CSUMB Data Warehouse - Retention and Graduation Dashboard
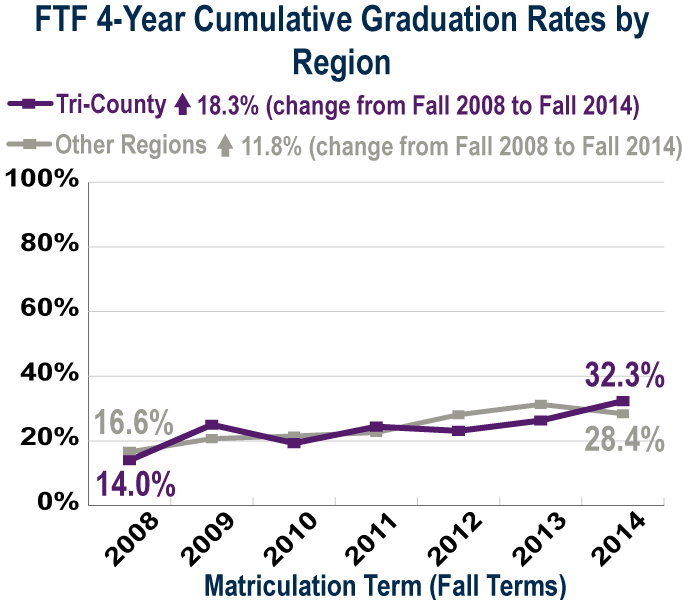
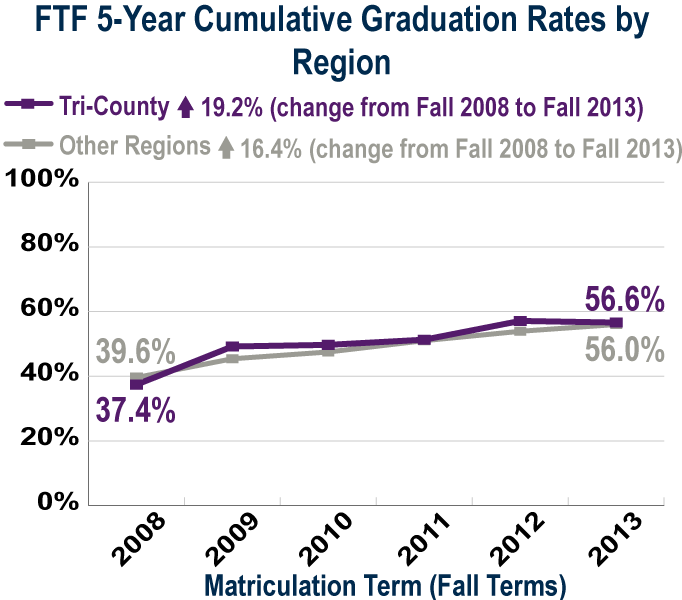
- CSUMB’s 4-year, 5-year, and 6-year cumulative graduation rates for tri-county FTF students have all risen since the Fall 2008 matriculation term at a greater magnitude than cumulative graduation rates for FTF students from other regions.
Over the last five years, 22% of entering FTF students came from CSUMB’s service area--the tri-county region, which includes Monterey, Santa Cruz, and San Benito Counties. The 4-year, 5-year, and 6-year cumulative graduation rates for FTF that came from the tri-county region and those that came from other regions have all risen since Fall 2008, but the cumulative graduation rates for FTF that come from the tri-county region have increased at a greater magnitude than the rates for FTF that come from other regions. The most significant difference in graduation achievement between Tri-County students and those from other regions is for 6-year cumulative graduation rates.
The 4-year cumulative graduation rate for FTF from the tri-county region increased from 14.0% for the Fall 2008 entering cohort to 32.3% for the Fall 2014 entering cohort, an increase of 18.3%. For FTF from other regions, the 4-year cumulative graduation rate increased from 16.6% to 28.4% for the same period, an increase of 11.8%. The 5-year cumulative graduation rate for FTF from the tri-county region increased from 37.4% for the Fall 2008 entering cohort to 56.6% for the Fall 2013 entering cohort, an increase of 19.2%. For FTF from other regions, the 5-year cumulative graduation rate increased from 39.6% to 56.0% for the same period, an increase of 16.4%. The 6-year cumulative graduation rate for FTF from the tri-county region increased from 42.1% for the Fall 2008 entering cohort to 67.0% for the Fall 2012 entering cohort, an increase of 24.9%. For FTF from other regions, the 6-year cumulative graduation rate increased from 44.8% to 58.5% for the same period, an increase of 13.7%.
Matriculation Term Region FTF 4-Year Cumulative Graduation FTF 5-Year Cumulative Graduation FTF 6-Year Cumulative Graduation Fall 2008 Tri-County 14.0% 37.4% 42.1% Fall 2008 Other Regions 16.6% 39.6% 44.8% Fall 2009 Tri-County 25.0% 49.2% 57.5% Fall 2009 Other Regions 20.7% 45.4% 52.1% Fall 2010 Tri-County 19.3% 49.7% 57.2% Fall 2010 Other Regions 21.5% 47.5% 53.5% Fall 2011 Tri-County 24.4% 51.3% 59.6% Fall 2011 Other Regions 22.6% 51.0% 59.3% Fall 2012 Tri-County 23.1% 57.1% 67.0% Fall 2012 Other Regions 28.1% 53.9% 58.5% Fall 2013 Tri-County 26.3% 56.6% Fall 2013 Other Regions 31.3% 56.0% Fall 2014 Tri-County 32.3% Fall 2014 Other Regions 28.4%
What Are CSUMB's Upper Division Transfer (UDT) Graduation Rates?
Overall UDT Graduation Rates
Source: CSUMB Data Warehouse - Retention and Graduation Dashboard
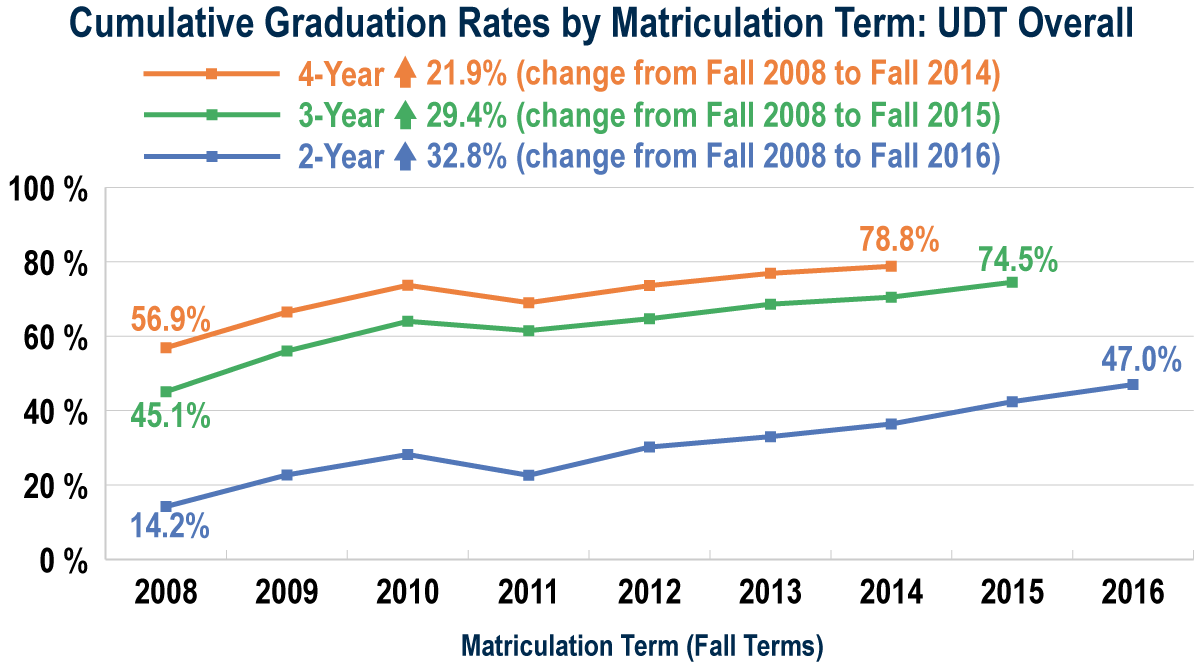
- CSUMB’s 2-year, 3-year, and 4-year UDT overall cumulative graduation rates have all increased from the Fall 2008 matriculation term.
UDT 2-year cumulative graduation rates have increased from 14.2% for the Fall 2008 entering cohort to 47.0% for the Fall 2016 entering cohort, an increase of 32.8%. UDT 3-year cumulative graduation rates have increased from 45.1% for the Fall 2008 entering cohort to 74.5% for the Fall 2015 entering cohort, an increase of 29.4%. UDT 4-year cumulative graduation rates have increased from 56.9% for the Fall 2008 entering cohort to 78.8% for the Fall 2014 entering cohort, an increase of 21.9%.
Matriculation Term UDT 2-Year Cumulative Graduation UDT 3-Year Cumulative Graduation UDT 4-Year Cumulative Graduation Fall 2008 14.2% 45.1% 56.9% Fall 2009 22.7% 56.0% 66.5% Fall 2010 28.2% 64.0% 73.7% Fall 2011 22.6% 61.5% 69.0% Fall 2012 30.2% 64.7% 73.6% Fall 2013 33.0% 68.6% 76.9% Fall 2014 36.4% 70.5% 78.8% Fall 2015 42.4% 74.5% Fall 2016 47.0%
Underrepresented Minority (URM) vs. Non-URM UDT Graduation Rates
Source: CSUMB Data Warehouse - Retention and Graduation Dashboard
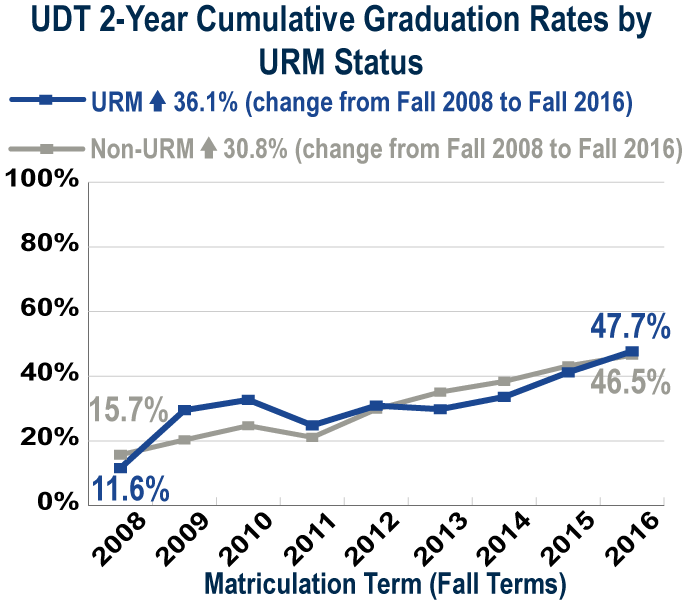
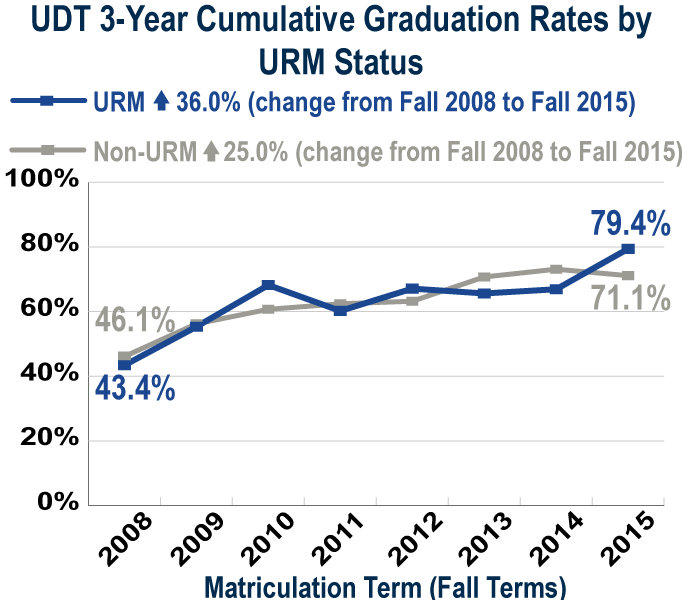
- CSUMB’s 2-year, 3-year, and 4-year cumulative graduation rates for URM UDT and non-URM UDT students have risen since Fall 2008, with a greater magnitude increase in the 2-year and 3-year rates for URM UDT and in the 4-year rates for non-URM UDT.
URM students have made up 43% of all entering UDT students over the past five years. While the 2-year, 3-year, and 4-year cumulative graduation rates for both URM UDT and non-URM UDT students have risen since the Fall 2008 matriculation term, the 2-year and 3-year cumulative graduation rates have increased at a greater magnitude for URM UDT and the 4-year cumulative graduation rates have increased at a greater magnitude for non-URM UDT.
The 2-year cumulative graduation rate for URM UDT increased from 11.6% for the Fall 2008 entering cohort to 47.7% for the Fall 2016 entering cohort, an increase of 36.1%. The 2-year cumulative graduation rate for non-URM UDT increased from 15.7% for the Fall 2008 entering cohort to 46.5% for the Fall 2016 entering cohort, an increase of 30.8%. The 3-year cumulative graduation rate for URM UDT increased from 43.4% for the Fall 2008 entering cohort to 79.4% for the Fall 2015 entering cohort, an increase of 36.0%. The 3-year cumulative graduation rate for non-URM UDT increased from 46.1% for the Fall 2008 entering cohort to 71.1% for the Fall 2015 entering cohort, an increase of 25.0%. The 4-year cumulative graduation rate for URM UDT increased from 55.0% for the Fall 2008 entering cohort to 75.6% for the Fall 2014 entering cohort, an increase of 20.6%. The 4-year cumulative graduation rate for non-URM UDT increased from 58.1% for the Fall 2008 entering cohort to 81.2% for the Fall 2014 entering cohort, an increase of 23.1%.
Matriculation Term URM Status UDT 2-Year Cumulative Graduation UDT 3-Year Cumulative Graduation UDT 4-Year Cumulative Graduation Fall 2008 URM 11.6% 43.4% 55.0% Fall 2008 Non-URM 15.7% 46.1% 58.1% Fall 2009 URM 29.5% 55.3% 65.9% Fall 2009 Non-URM 20.3% 56.2% 66.8% Fall 2010 URM 32.7% 68.2% 78.7% Fall 2010 Non-URM 24.7% 60.7% 69.8% Fall 2011 URM 24.8% 60.2% 68.6% Fall 2011 Non-URM 21.1% 62.4% 69.3% Fall 2012 URM 30.9% 67.1% 74.4% Fall 2012 Non-URM 29.8% 63.2% 73.1% Fall 2013 URM 29.8% 65.6% 72.2% Fall 2013 Non-URM 35.1% 70.7% 80.0% Fall 2014 URM 33.6% 66.9% 75.6% Fall 2014 Non-URM 38.4% 73.1% 81.2% Fall 2015 URM 41.2% 79.4% Fall 2015 Non-URM 43.2% 71.1% Fall 2016 URM 47.7% Fall 2016 Non-URM 46.5%
Received Pell Aid vs. Did Not Receive Pell Aid UDT Graduation Rates
Source: CSUMB Data Warehouse - Retention and Graduation Dashboard
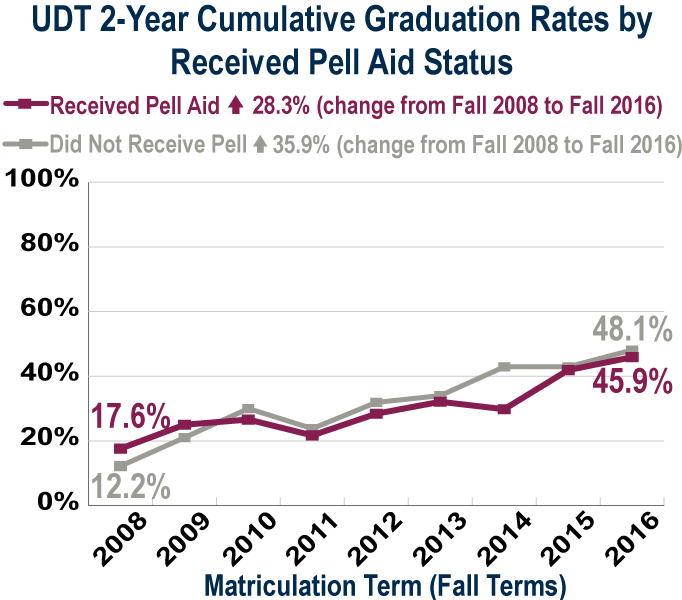
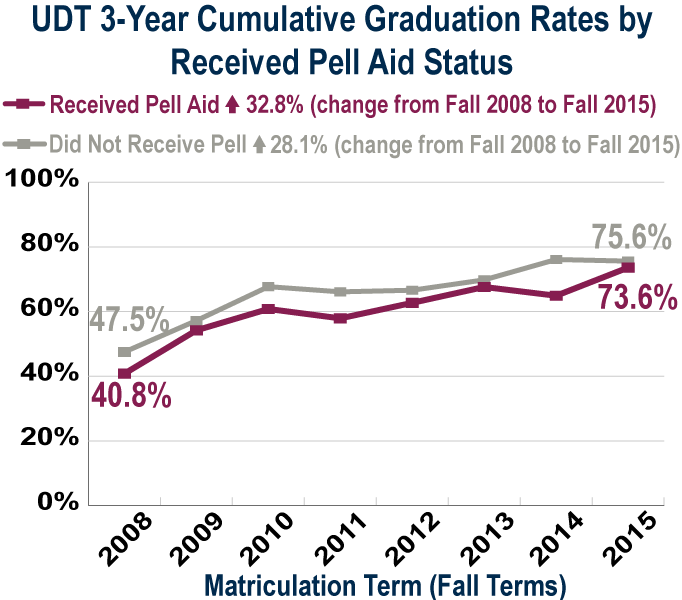
- CSUMB’s 2-year, 3-year, and 4-year cumulative graduation rates for UDT students that received Pell aid at matriculation and UDT that did not receive Pell aid at matriculation have all risen since Fall 2008, with a greater magnitude increase in the 2-year and 4-year rates for UDT that did not receive Pell aid at matriculation and in the 3-year rates for UDT that received Pell aid at matriculation.
Over the previous five years, 52% of entering UDT students received Pell aid at matriculation. The 2-year and 4-year cumulative graduation rates for UDT student that did not receive Pell aid at matriculation have increased at a greater magnitude than for UDT students that did receive Pell aid at matriculation while the 3-year cumulative graduation rates increased at a greater magnitude for UDT students that did receive Pell aid at matriculation.
The 2-year cumulative graduation rate for UDT that received Pell aid at matriculation increased from 17.6% for the Fall 2008 entering cohort to 45.9% for the Fall 2016 entering cohort, an increase of 28.3%. The 2-year cumulative graduation rate for UDT that did not receive Pell aid at matriculation increased from 12.2% to 48.1% for the same period, an increase of 35.9%. The 3-year cumulative graduation rate for UDT that received Pell aid at matriculation increased from 40.8% for the Fall 2008 entering cohort to 73.6% for the Fall 2015 entering cohort, an increase of 32.8%. The 3-year cumulative graduation rate for UDT that did not receive Pell aid at matriculation increased from 47.5% to 75.6% for the same period, an increase of 28.1%. The 4-year cumulative graduation rate for UDT that received Pell aid at matriculation increased from 56.8% for the Fall 2008 entering cohort to 74.7% for the fall 2014 entering cohort, an increase of 17.9%. The 4-year cumulative graduation rate for UDT that did not receive Pell aid at matriculation increased from 57.0% to 83.0% for the same period, an increase of 26.0%.
Matriculation Term Received Pell Aid Status UDT 2-Year Cumulative Graduation UDT 3-Year Cumulative Graduation UDT 4-Year Cumulative Graduation Fall 2008 Received Pell Aid 17.6% 40.8% 56.8% Fall 2008 Did Not Receive Pell Aid 12.2% 47.5% 57.0% Fall 2009 Received Pell Aid 25.0% 54.2% 65.6% Fall 2009 Did Not Receive Pell Aid 21.0% 57.2% 67.2% Fall 2010 Received Pell Aid 26.6% 60.8% 72.2% Fall 2010 Did Not Receive Pell Aid 30.0% 67.7% 75.3% Fall 2011 Received Pell Aid 21.7% 57.9% 65.7% Fall 2011 Did Not Receive Pell Aid 23.8% 66.1% 73.2% Fall 2012 Received Pell Aid 28.4% 62.7% 72.2% Fall 2012 Did Not Receive Pell Aid 31.9% 66.6% 74.9% Fall 2013 Received Pell Aid 32.1% 67.6% 75.9% Fall 2013 Did Not Receive Pell Aid 34.0% 69.8% 78.0% Fall 2014 Received Pell Aid 29.8% 64.9% 74.7% Fall 2014 Did Not Receive Pell Aid 42.9% 76.1% 83.0% Fall 2015 Received Pell Aid 41.9% 73.6% Fall 2015 Did Not Receive Pell Aid 42.9% 75.6% Fall 2016 Received Pell Aid 45.9% Fall 2016 Did Not Receive Pell Aid 48.1%
Tri-County vs. Other Region UDT Graduation Rates
Source: CSUMB Data Warehouse- Retention and Graduation Dashboard
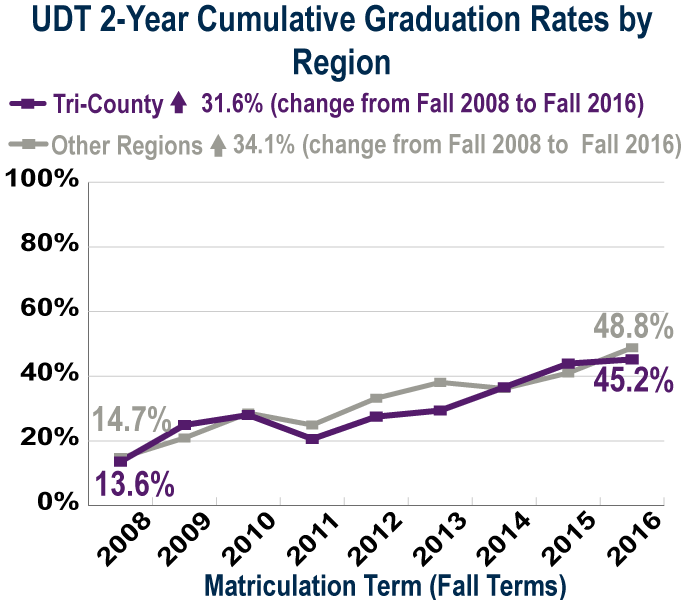
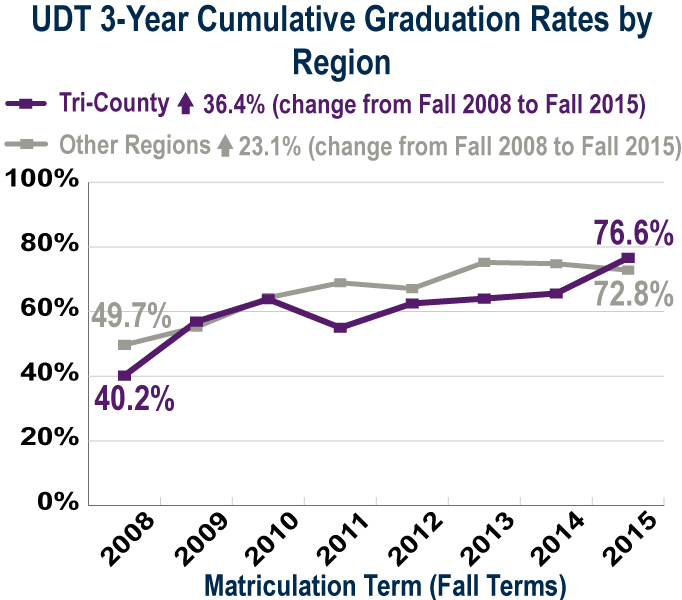
- CSUMB’s 2-year, 3-year, and 4-year cumulative graduation rates for tri-county UDT students and UDT students from other regions have all risen since the Fall 2008 matriculation term with the 2-year rate increasing at a greater magnitude for UDT from other regions and the 3-year and 4-year rates increasing at a greater magnitude for UDT from the tri-county region.
Over the past five years, 50% of entering UDT students came from the tri-county region. The 2-year cumulative graduation rate for UDT students from other regions increased at a greater magnitude than cumulative graduation rates for tri-county UDT students while the 3-year and 4-year cumulative graduation rates of tri-county UDT students have increased by a greater magnitude than those of UDT students from other regions.
The 2-year cumulative graduation rate for UDT students from the tri-county region increased from 13.6% for the Fall 2008 entering cohort to 45.2% for the Fall 2016 entering cohort, an increase of 31.6%. The 2-year cumulative graduation rate for UDT students from other regions increased from 14.7% to 48.8% for the same period, an increase of 34.1%. The 3-year cumulative graduation rate for UDT students from the tri-county region increased from 40.2% for the Fall 2008 entering cohort to 76.6% for the Fall 2015 entering cohort, an increase of 36.4%. The 3-year cumulative graduation rate for UDT students from other regions increased from 49.7% to 72.8% for the same period, an increase of 23.1%. The 4-year cumulative graduation rate for UDT students from the tri-county region increased from 53.3% for the Fall 2008 entering cohort to 77.8% for the Fall 2014 entering cohort, an increase of 24.5%. The 4-year cumulative graduation rate for UDT students from other regions increased from 60.5% to 79.8% for the same period, an increase of 19.3%.
Matriculation Term Region UDT 2-Year Cumulative Graduation UDT 3-Year Cumulative Graduation UDT 4-Year Cumulative Graduation Fall 2008 Tri-County 13.6% 40.2% 53.3% Fall 2008 Other Regions 14.7% 49.7% 60.5% Fall 2009 Tri-County 24.9% 56.9% 67.6% Fall 2009 Other Regions 20.9% 55.2% 65.7% Fall 2010 Tri-County 28.0% 63.8% 75.5% Fall 2010 Other Regions 28.6% 64.3% 70.2% Fall 2011 Tri-County 20.6% 55.0% 63.2% Fall 2011 Other Regions 24.9% 68.9% 75.5% Fall 2012 Tri-County 27.5% 62.5% 73.6% Fall 2012 Other Regions 33.2% 67.1% 73.5% Fall 2013 Tri-County 29.4% 64.0% 73.0% Fall 2013 Other Regions 38.1% 75.2% 82.4% Fall 2014 Tri-County 36.6% 65.6% 77.8% Fall 2014 Other Regions 36.2% 74.8% 79.8% Fall 2015 Tri-County 43.9% 76.6% Fall 2015 Other Regions 41.0% 72.8% Fall 2016 Tri-County 45.2% Fall 2016 Other Regions 48.8%
How Can You Learn More About CSUMB's Graduation Rates and Find Data for Students in Your College or Program?
The CSUMB Data Warehouse includes a detailed Retention and Graduation dashboard, which can tell you more about retention and graduation rates and counts tracked from the time students begin studies at CSUMB through ten years. You can use the Retention and Graduation dashboard to see overviews for individual colleges and majors, compare trends across different group breakdowns (e.g. college, major, student demographics, student financial aid, student preparation, and participation in programs), and explore equity gaps in achievement. Access to the CSUMB Data Warehouse is available to staff and faculty on campus only. To find out how to get access, see IAR's CSUMB Data Warehouse page.
IAR is located in Green Hall (Building 58)
