About our colleges
College of Arts, Humanities, and Social Sciences
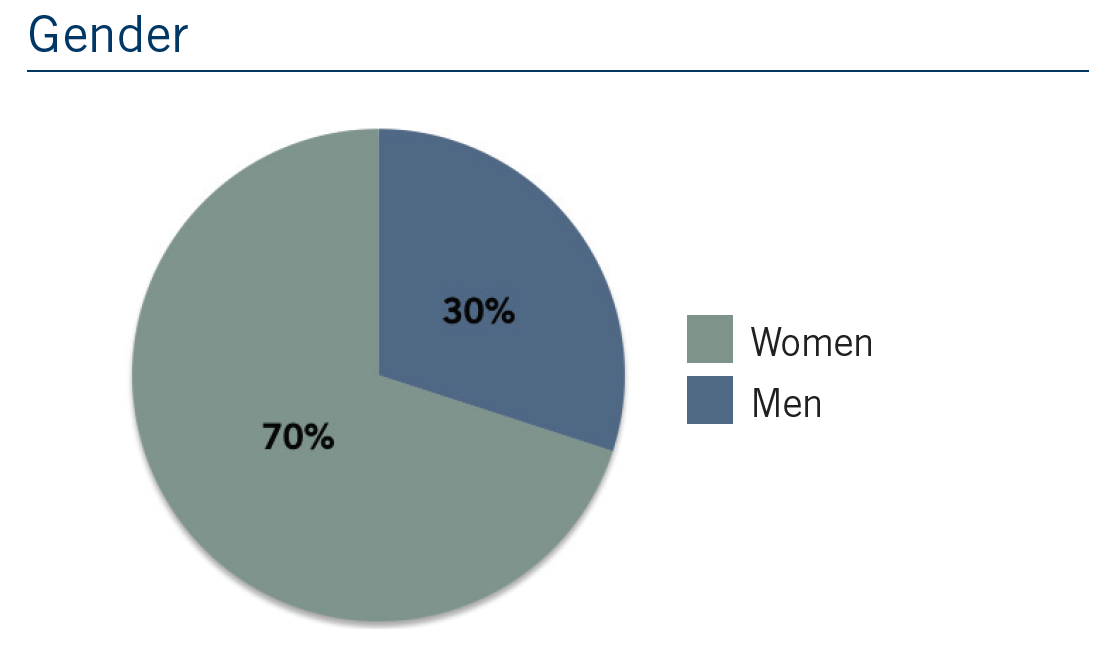
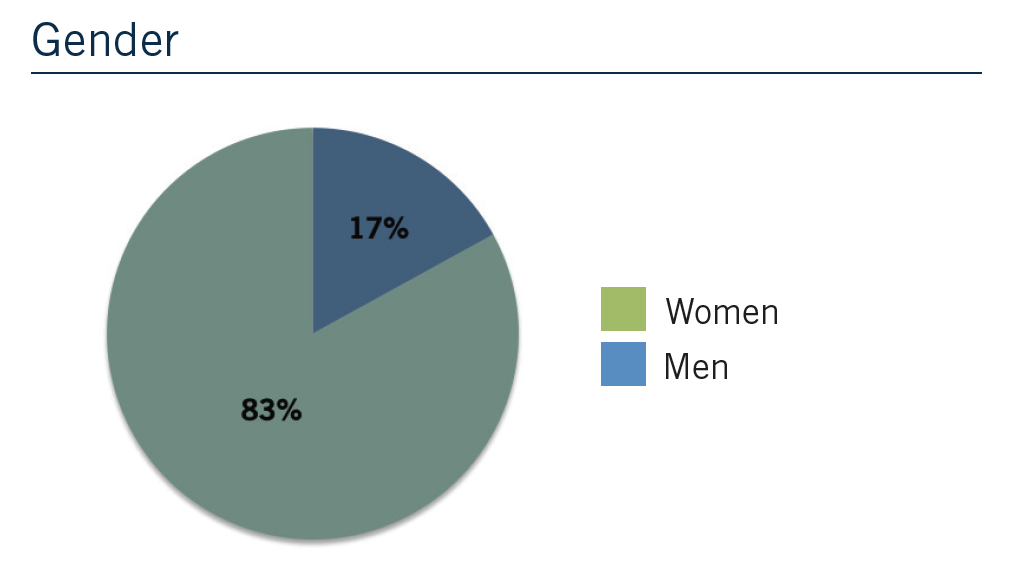
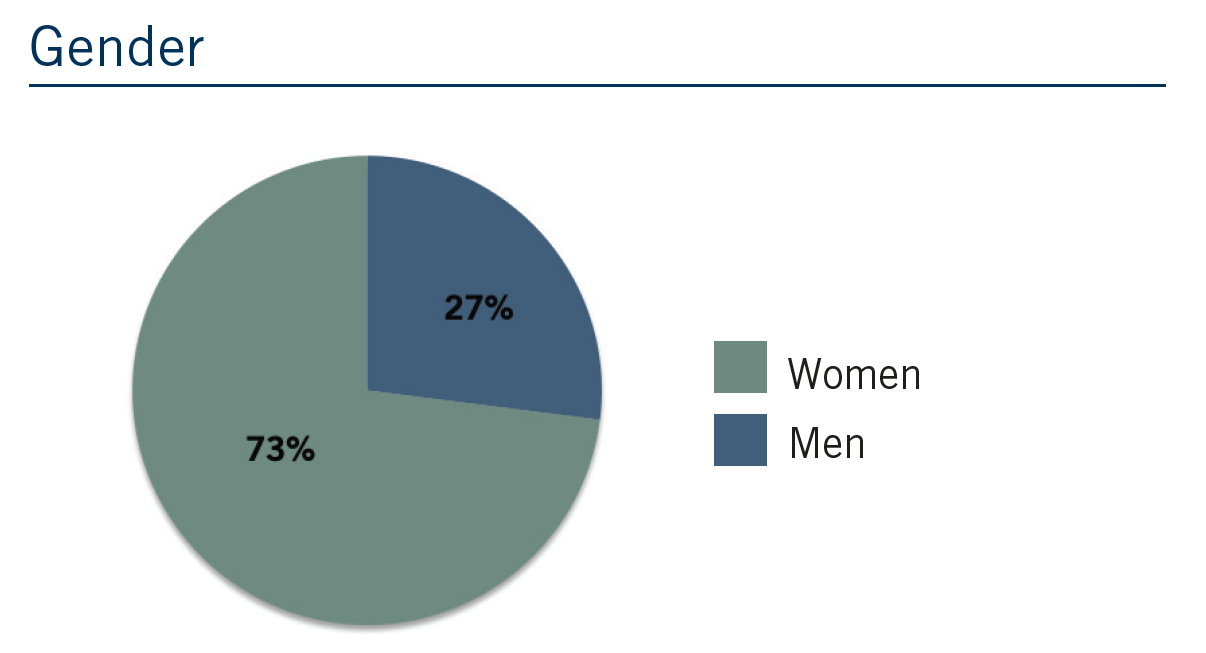
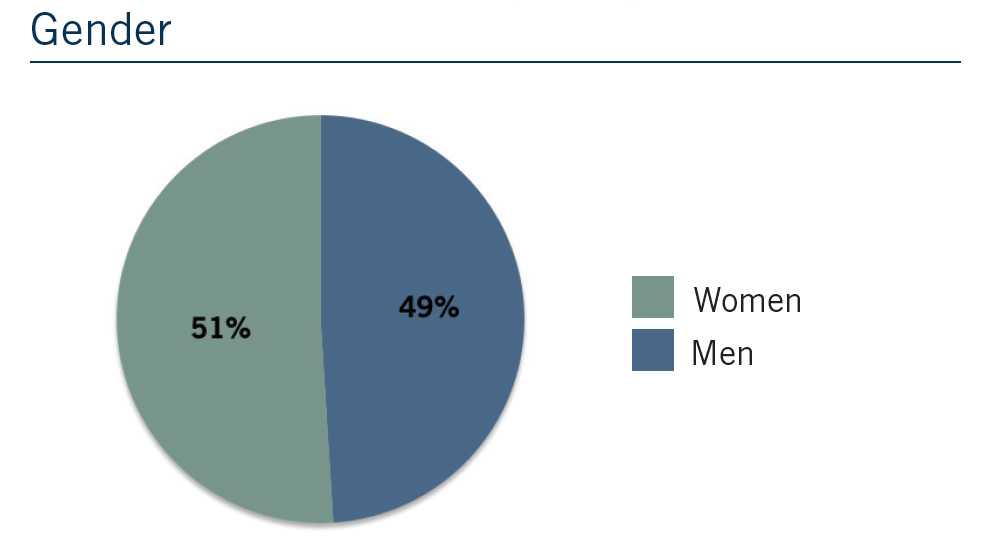
Gender
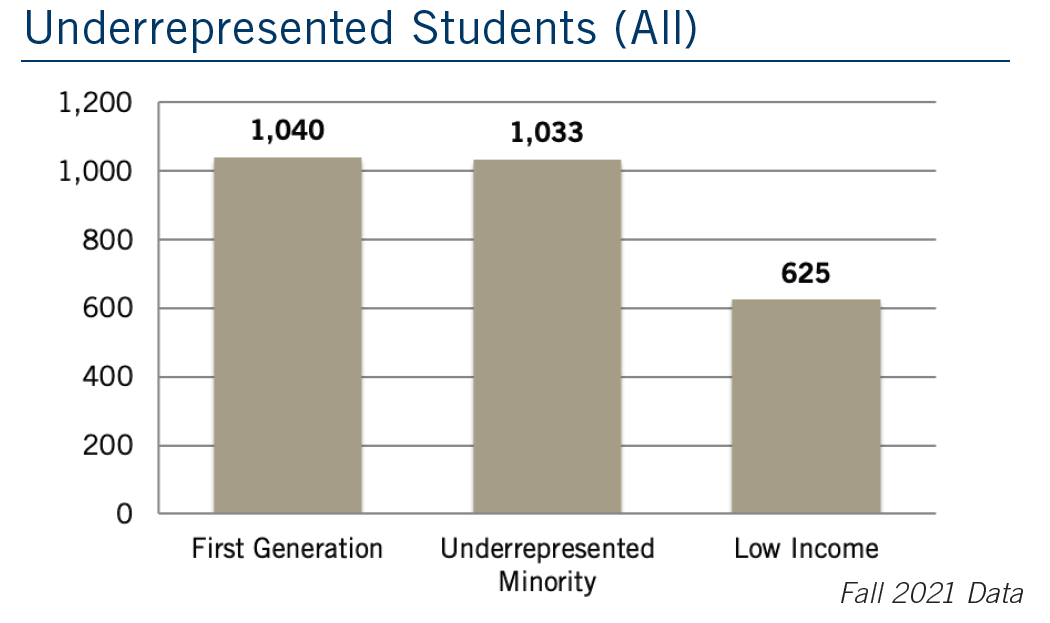
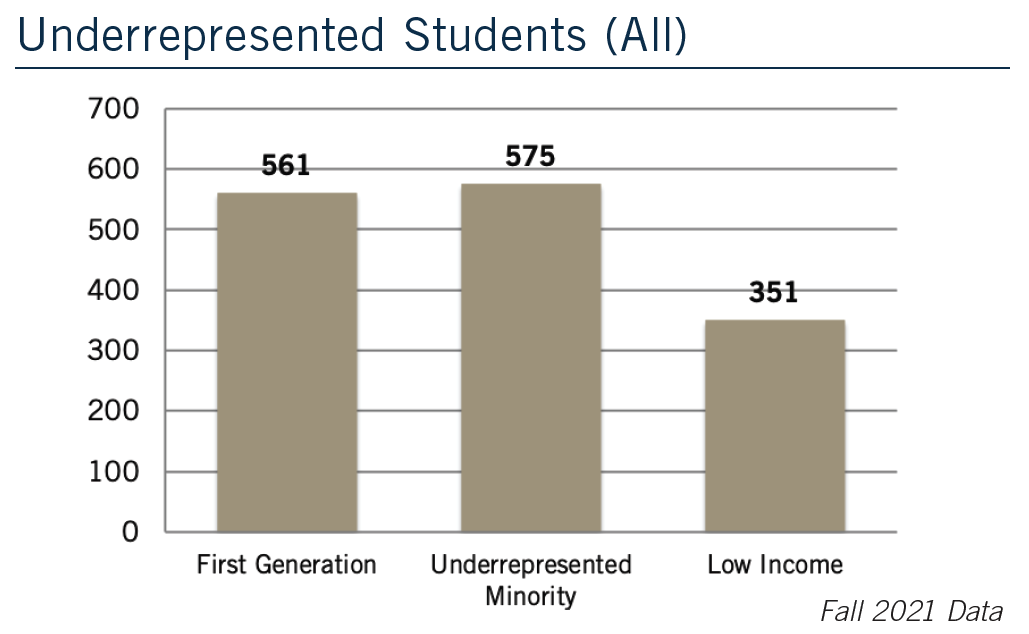
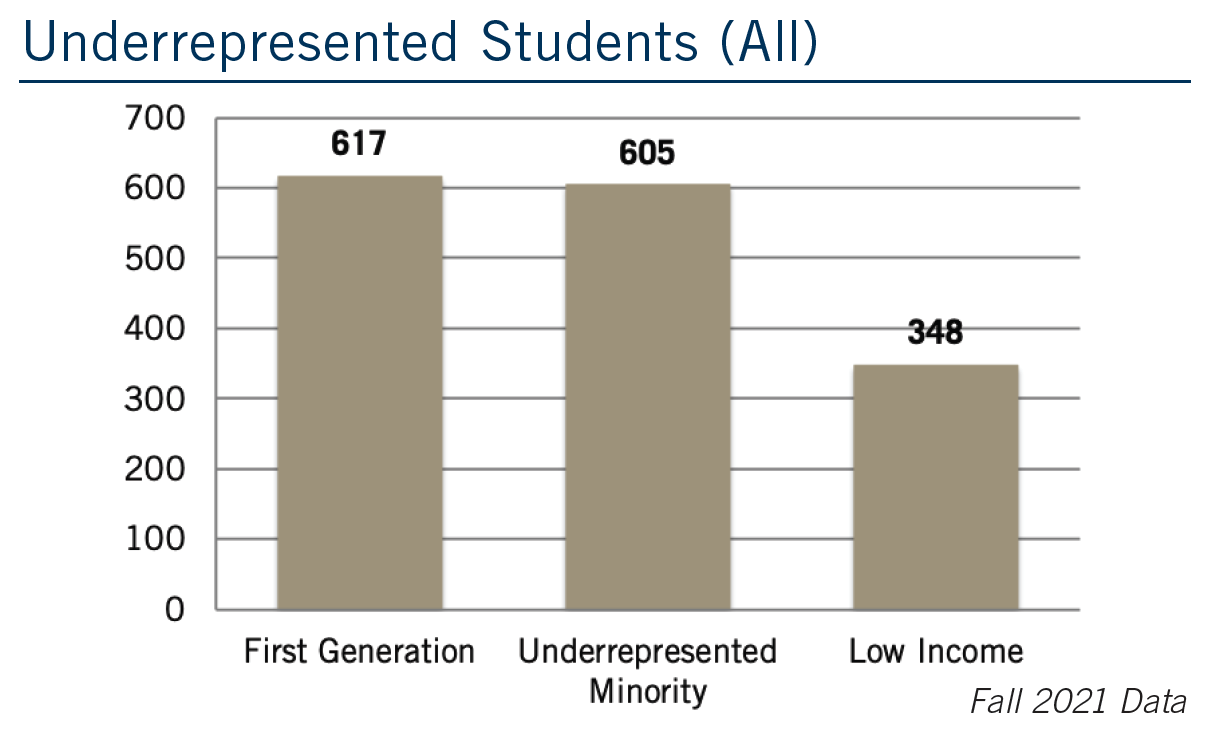
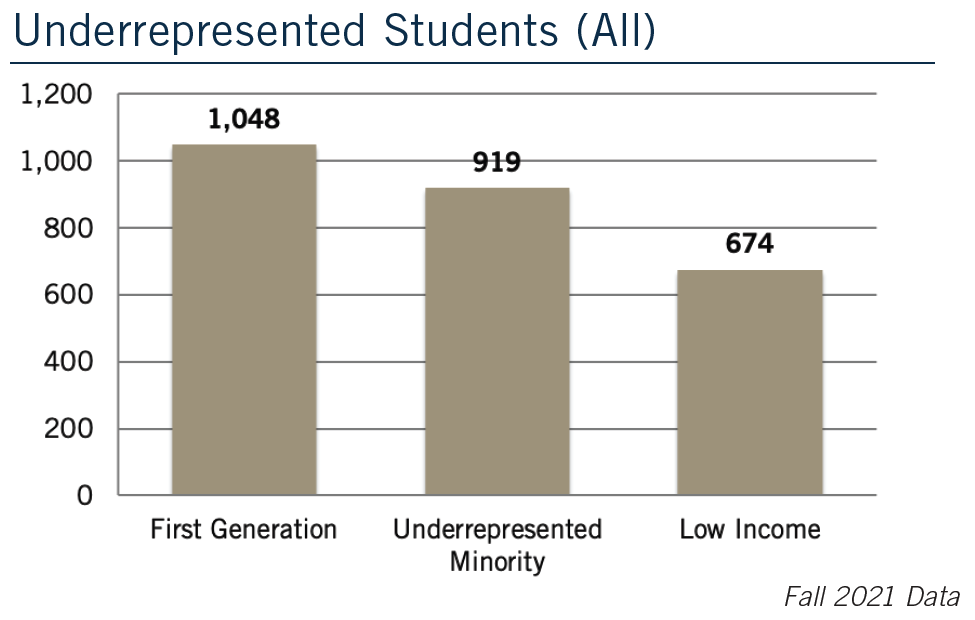
Underrepresented groups
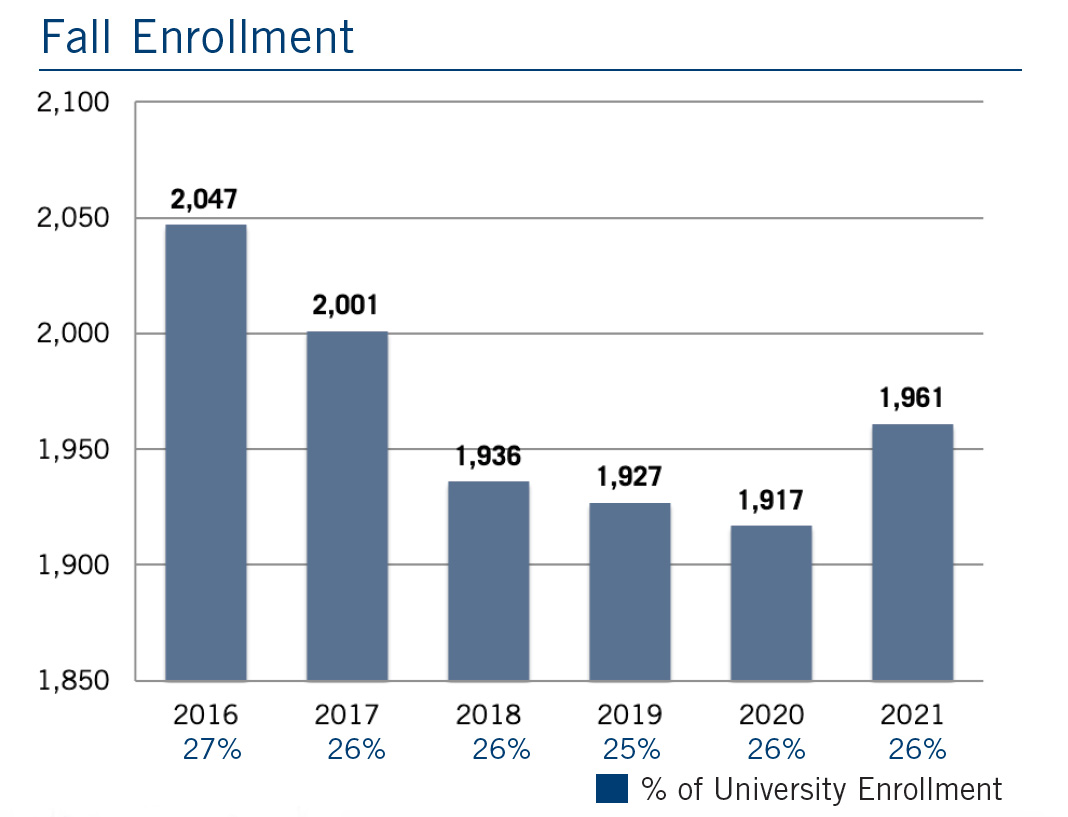
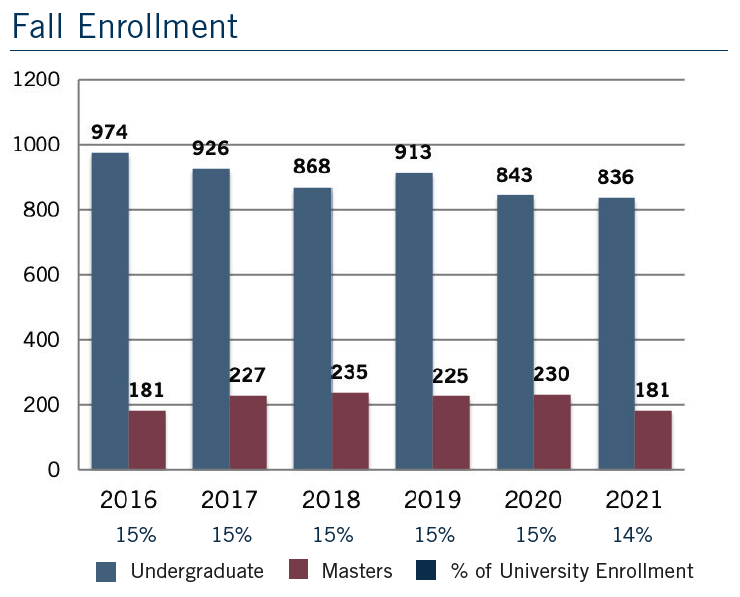
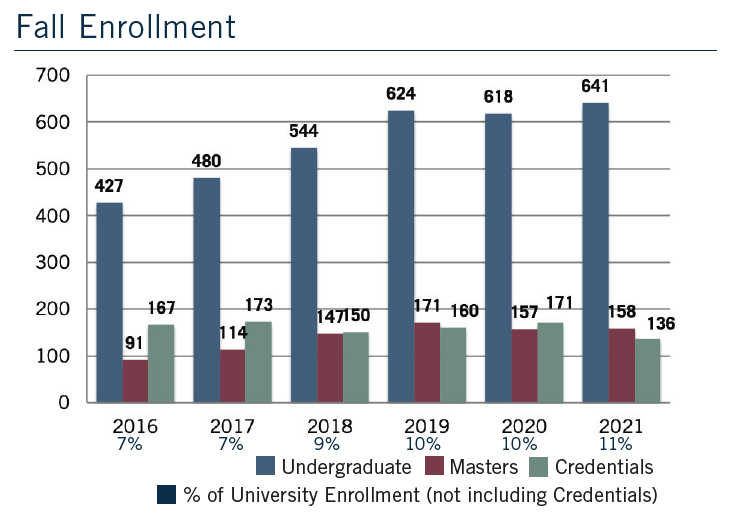
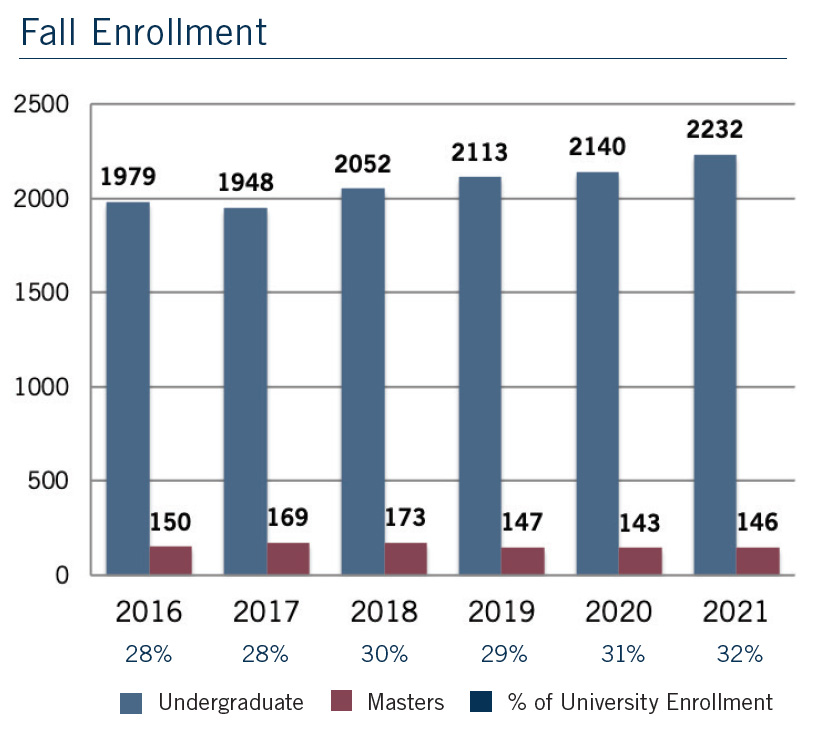
Fall enrollment
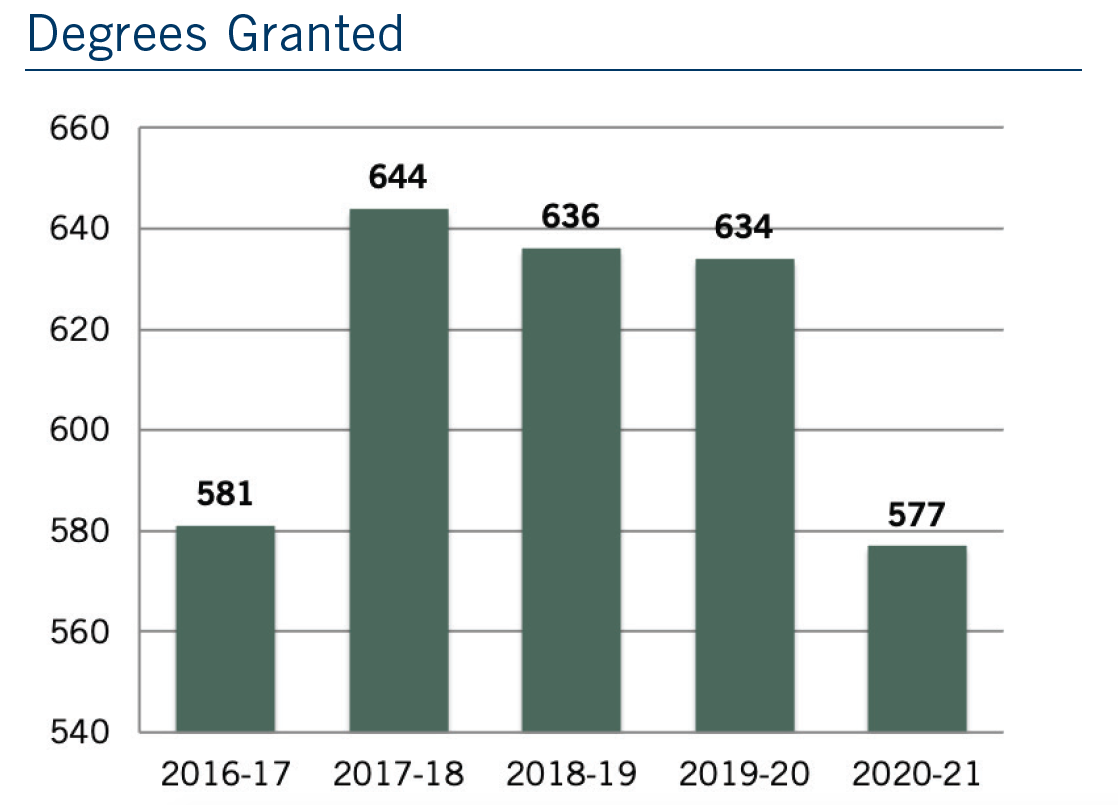
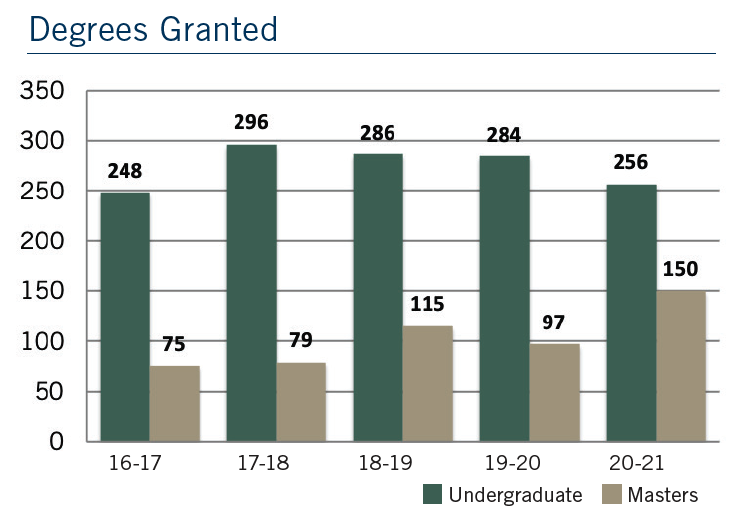
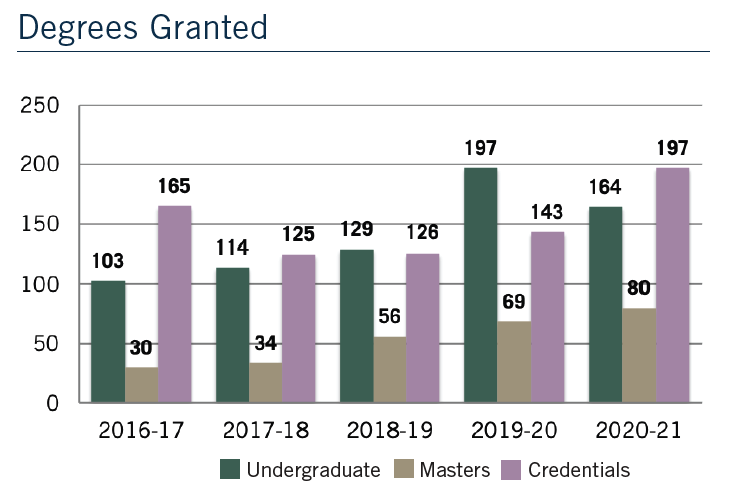
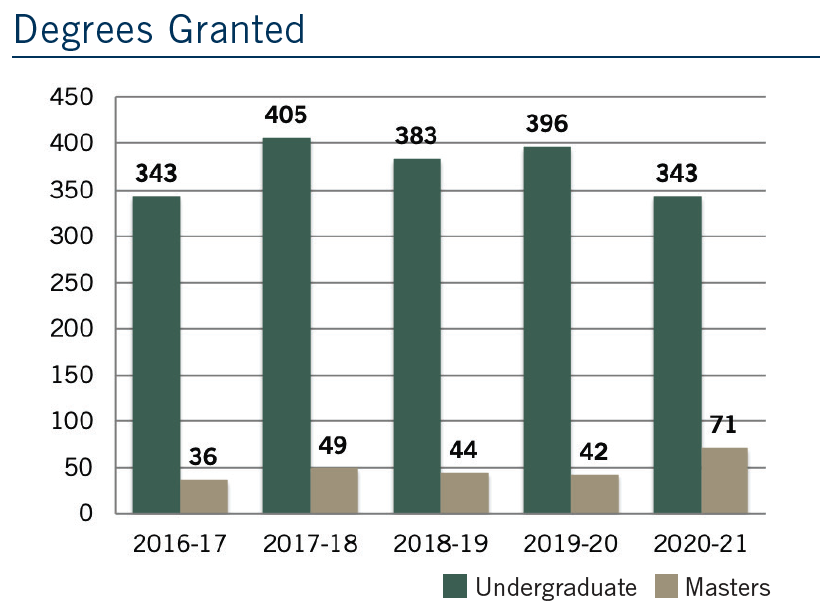
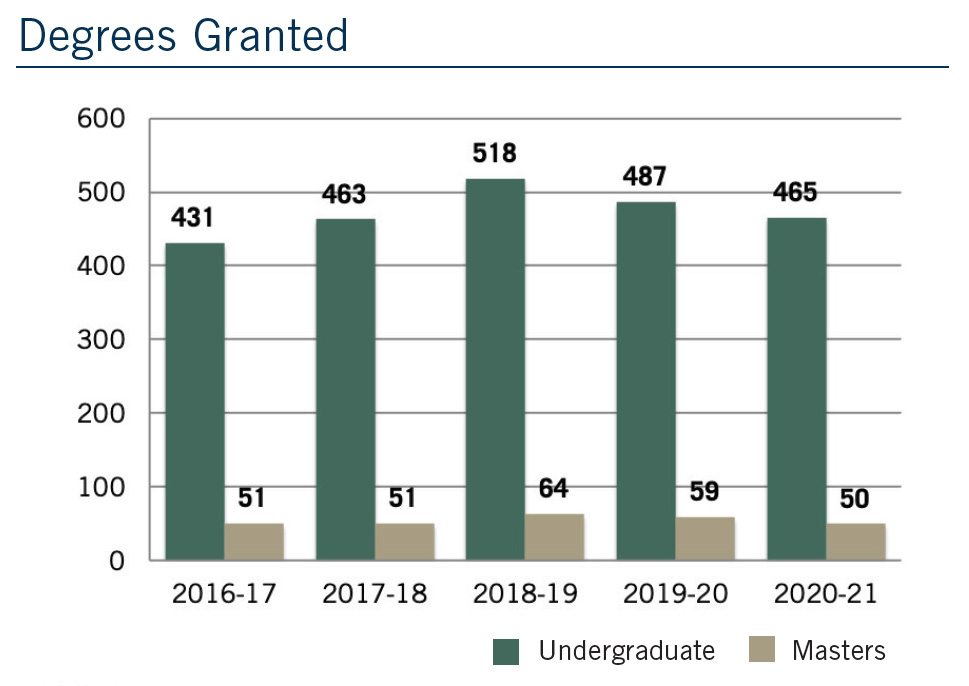
Degrees granted
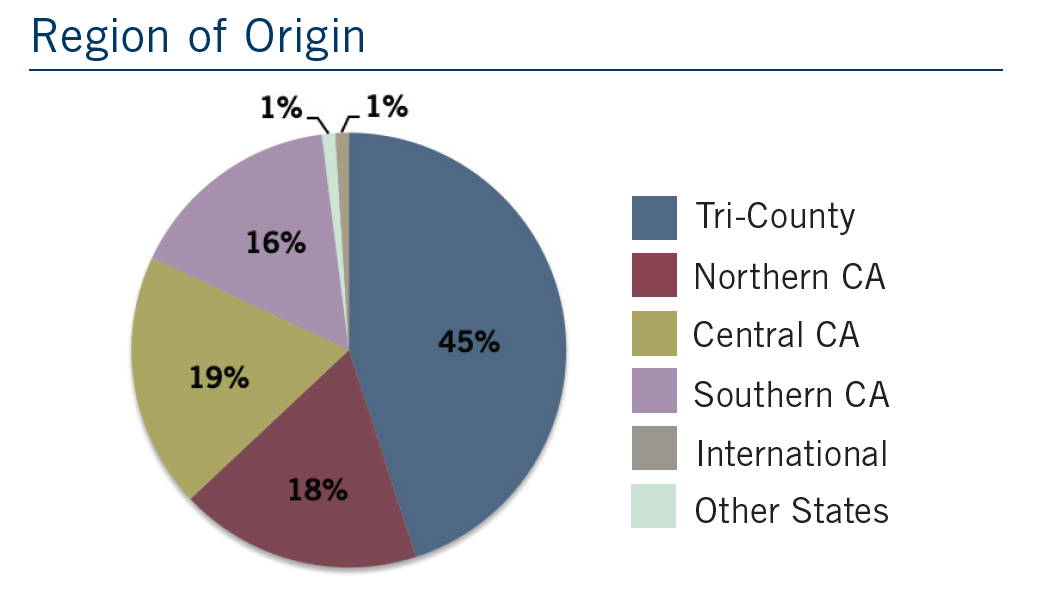
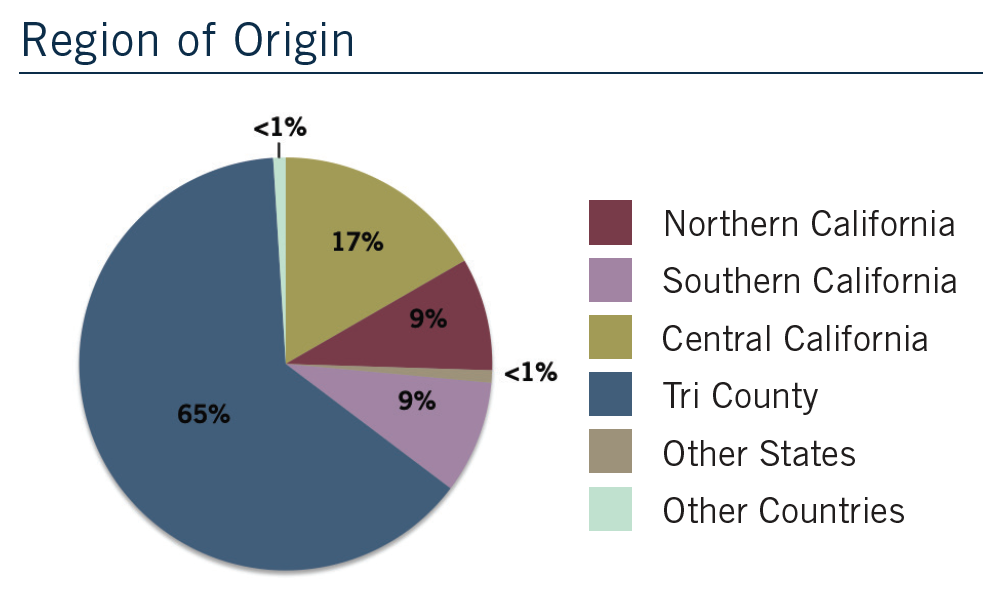
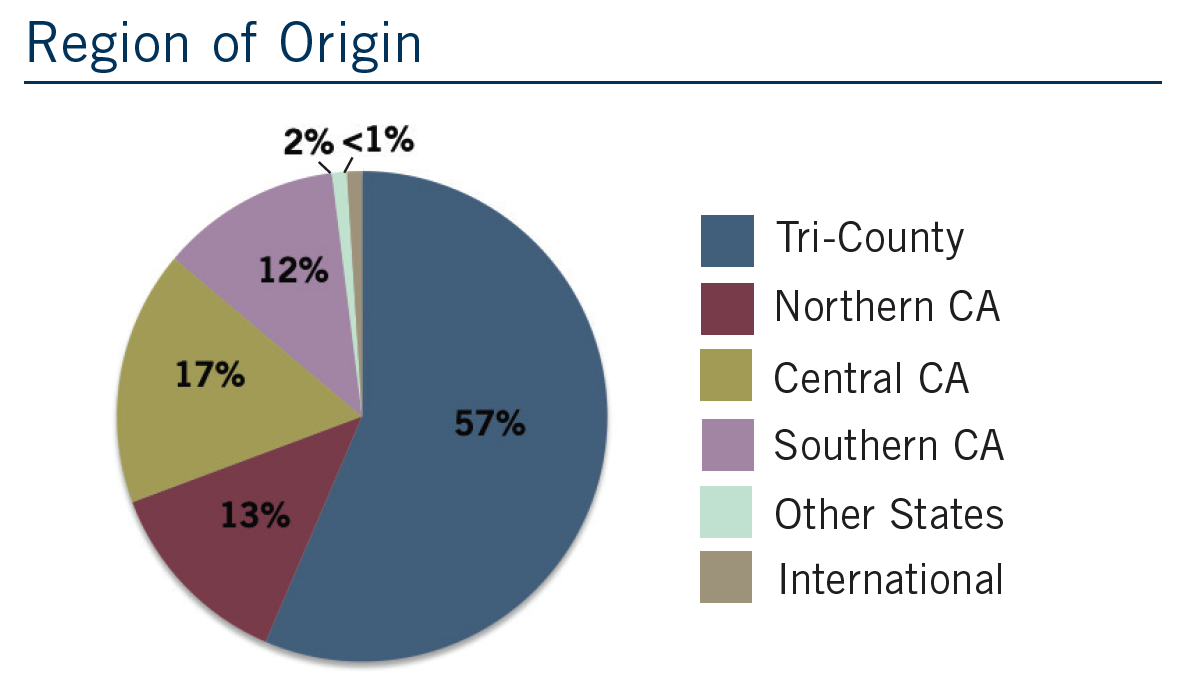
Region of origin
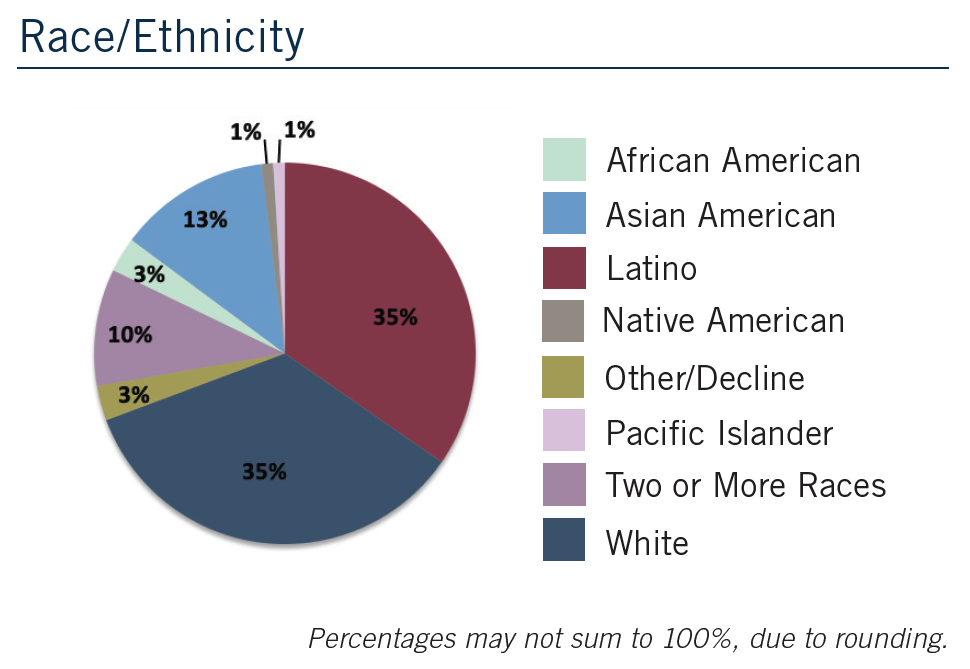
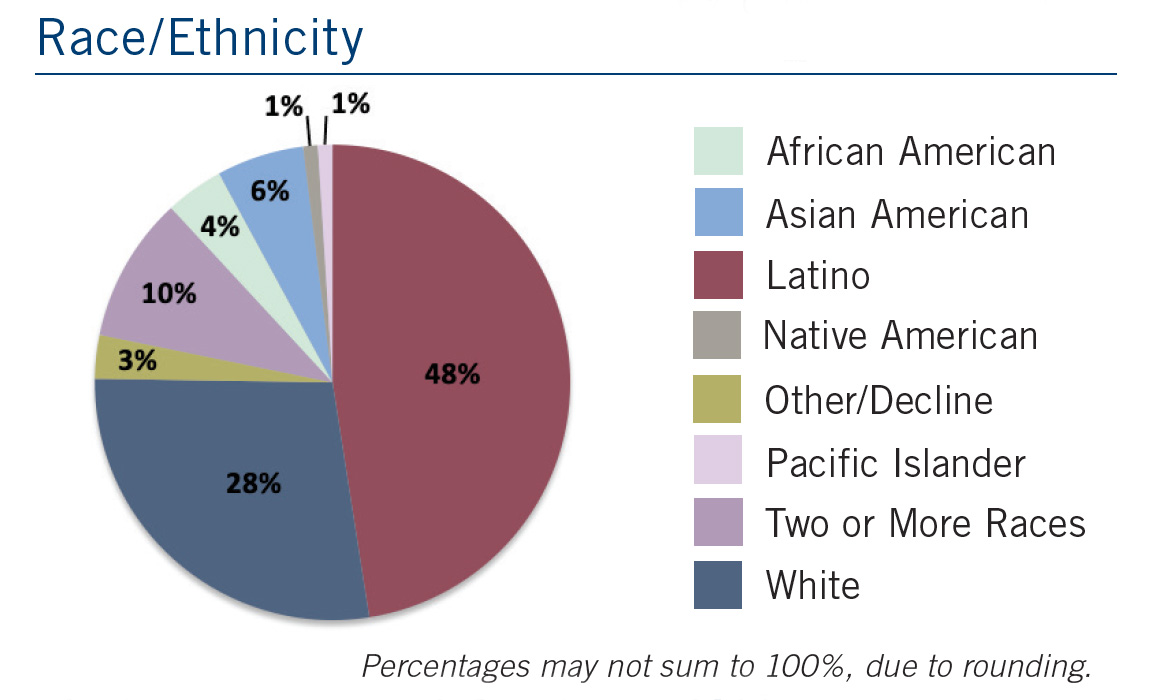
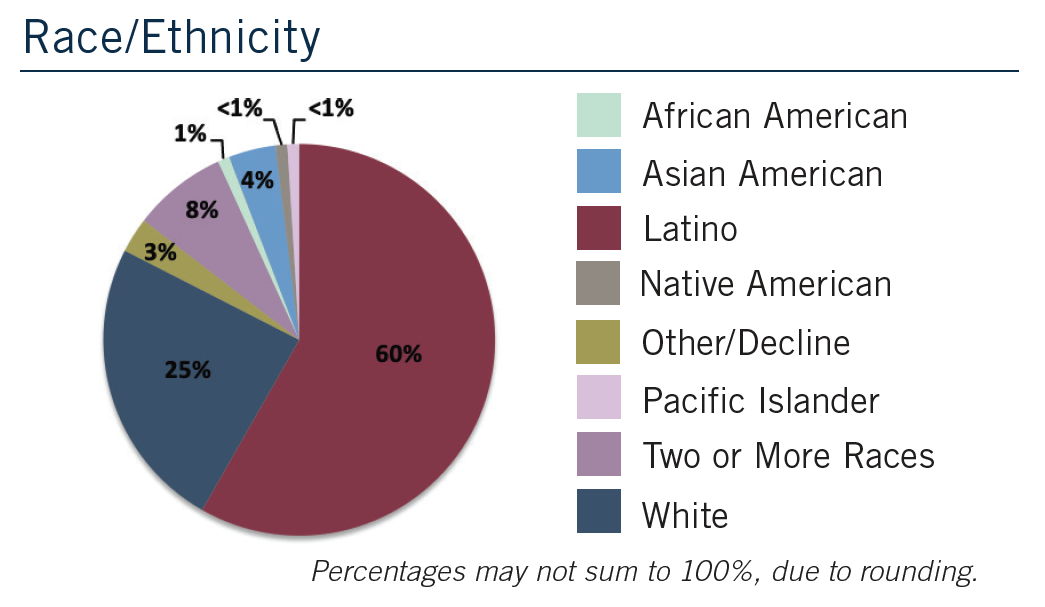
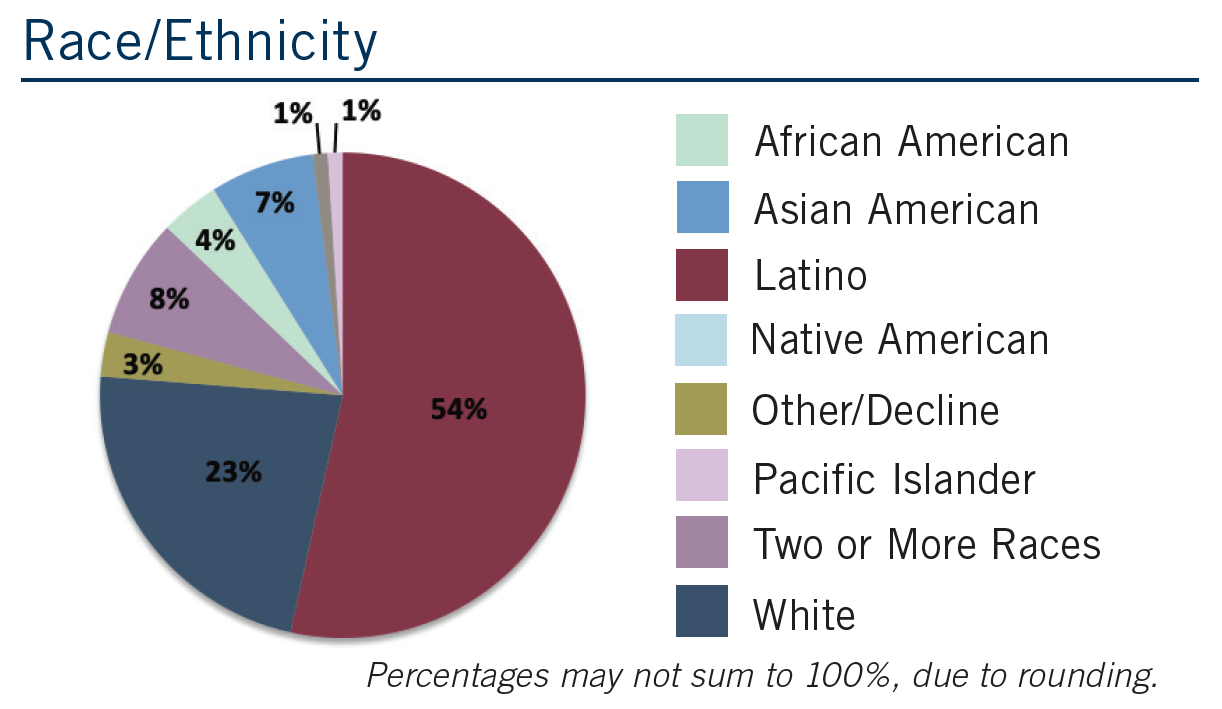
Ethnicity
College of Business
Gender

Underrepresented groups

Fall enrollment
Degrees granted
Ethnicity

College of Education
Gender
Underrepresented groups
Fall enrollment
Degrees granted
Region of origin
Ethnicity
College of Health Sciences and Human Services
Gender
Underrepresented groups
Fall enrollment
Degrees granted
Region of origin
Ethnicity
College of Science
Gender
Underrepresented groups
Fall enrollment
Degrees granted
Ethnicity