New Transfers Enrollment

All Degree-Seeking Transfers
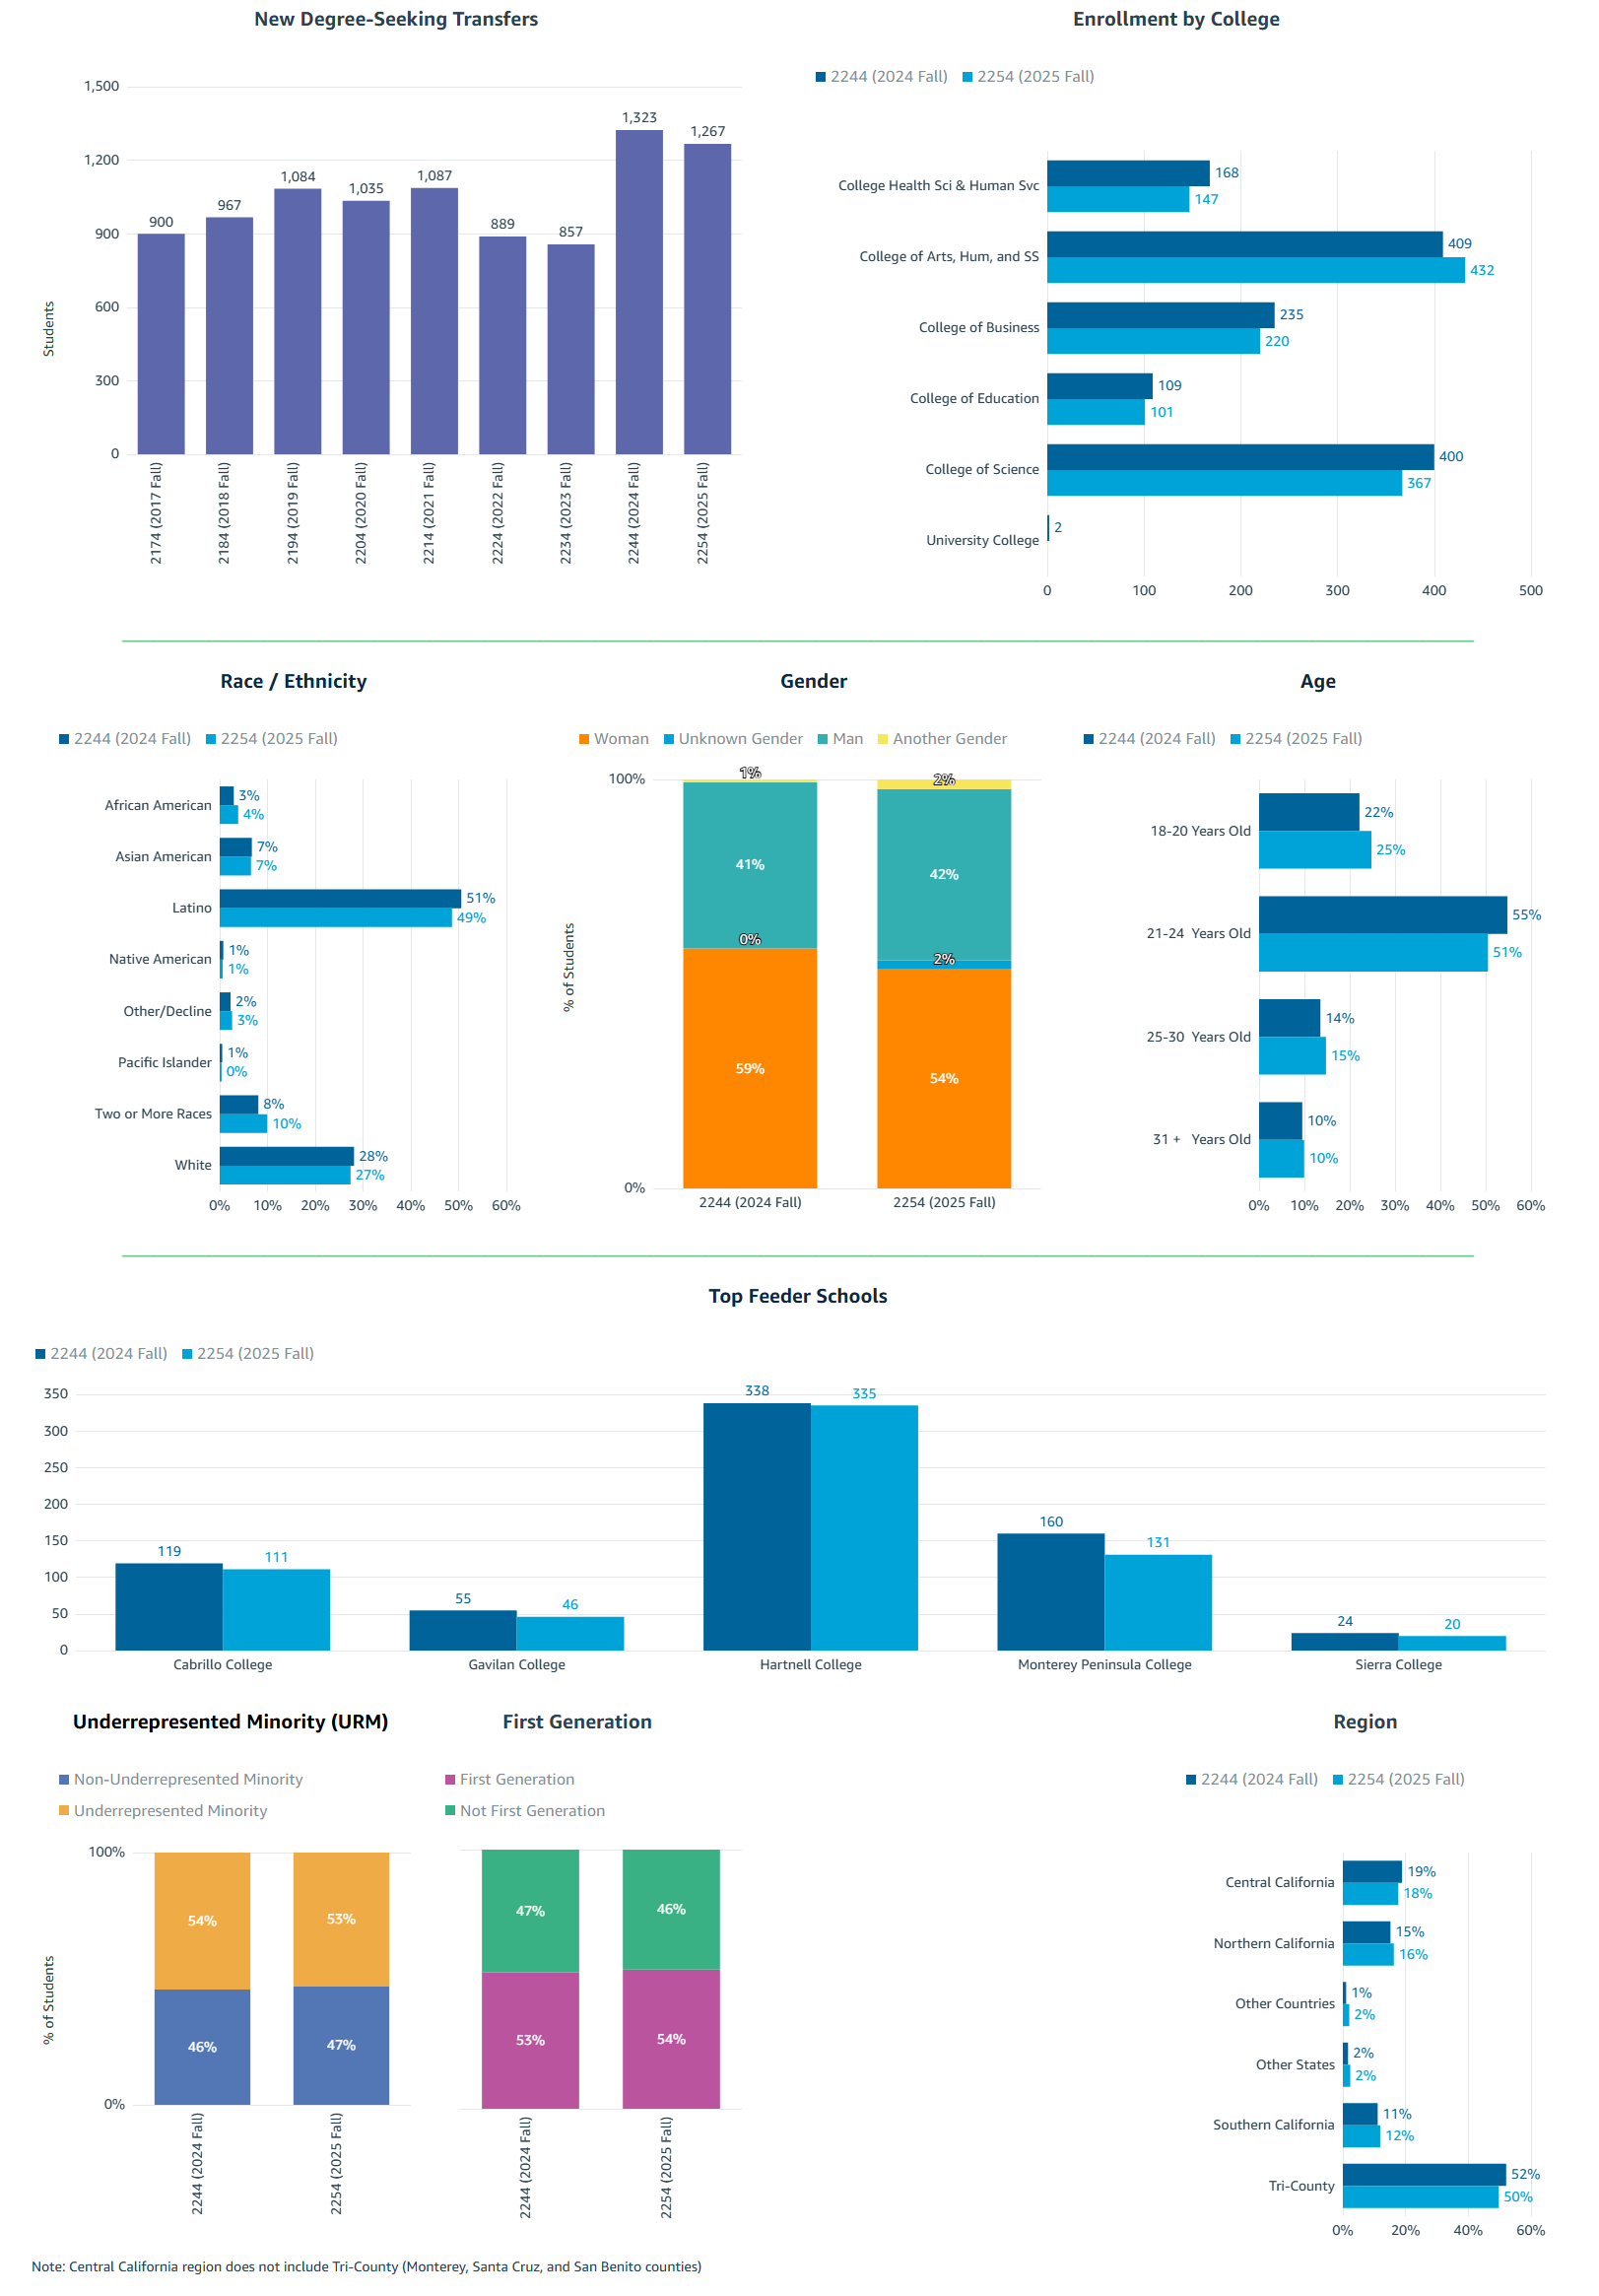
Term Students 2017 Fall 900 2018 Fall 967 2019 Fall 1,084 2020 Fall 1,035 2021 Fall 1,087 2022 Fall 889 2023 Fall 857 2024 Fall 1,323 2025 Fall 1,267 Enrollment by College
College 2024 Fall 2025 Fall College Health Sciences & Human Services 168 147 College of Arts, Humanities, and Social Sciences 409 432 College of Business 235 220 College of Education 109 101 College of Science 400 367 University College 2 Race / Ethnicity
Race / Ethnicity 2024 Fall 2025 Fall African American 3% 4% Asian American 7% 7% Latino 51% 49% Native American 1% 1% Other / Decline 2% 3% Pacific Islander 1% 0% Two or More Races 8% 10% White 28% 27% Gender
Gender 2024 Fall 2025 Fall Woman 59% 54% Man 41% 42% Another Gender 1% 2% Unknown Gender 0% 2% Age
Age 2024 Fall 2025 Fall 18 - 20 Years Old 22% 25% 21 - 24 Years Old 55% 51% 25 - 30 Years Old 14% 15% 31 + Years Old 10% 10% Top Feeder Schools (Students Count)
School 2024 Fall 2025 Fall Cabrillo College 119 111 Gavilan College 55 46 Hartnell Community College 338 335 Monterey Peninsula College 160 131 Sierra College 24 20 Underrepresented Minority (URM)
Underrepresented Minority (URM) 2024 Fall 2025 Fall Non-URM 46% 47% URM 54% 53% First Generation
First Generation 2024 Fall 2025 Fall First Generation 53% 54% Not First Generation 47% 46% Region
Region 2024 Fall 2025 Fall Central California 19% 18% Northern California 15% 16% Other Countries 1% 2% Other States 2% 2% Southern California 11% 12% Tri-County 52% 50% Note: Central California region does not include Tri-County (Monterey, Santa Cruz, and San Benito counties)
Source: Campus Data Warehouse. Enrollment (Census) Overviews, Degree-Seeking Transfers.
All data are based on Census data extracted for the Chancellor's Office at State census.