Graduate Students Enrollment

All Degree-Seeking Graduate Students
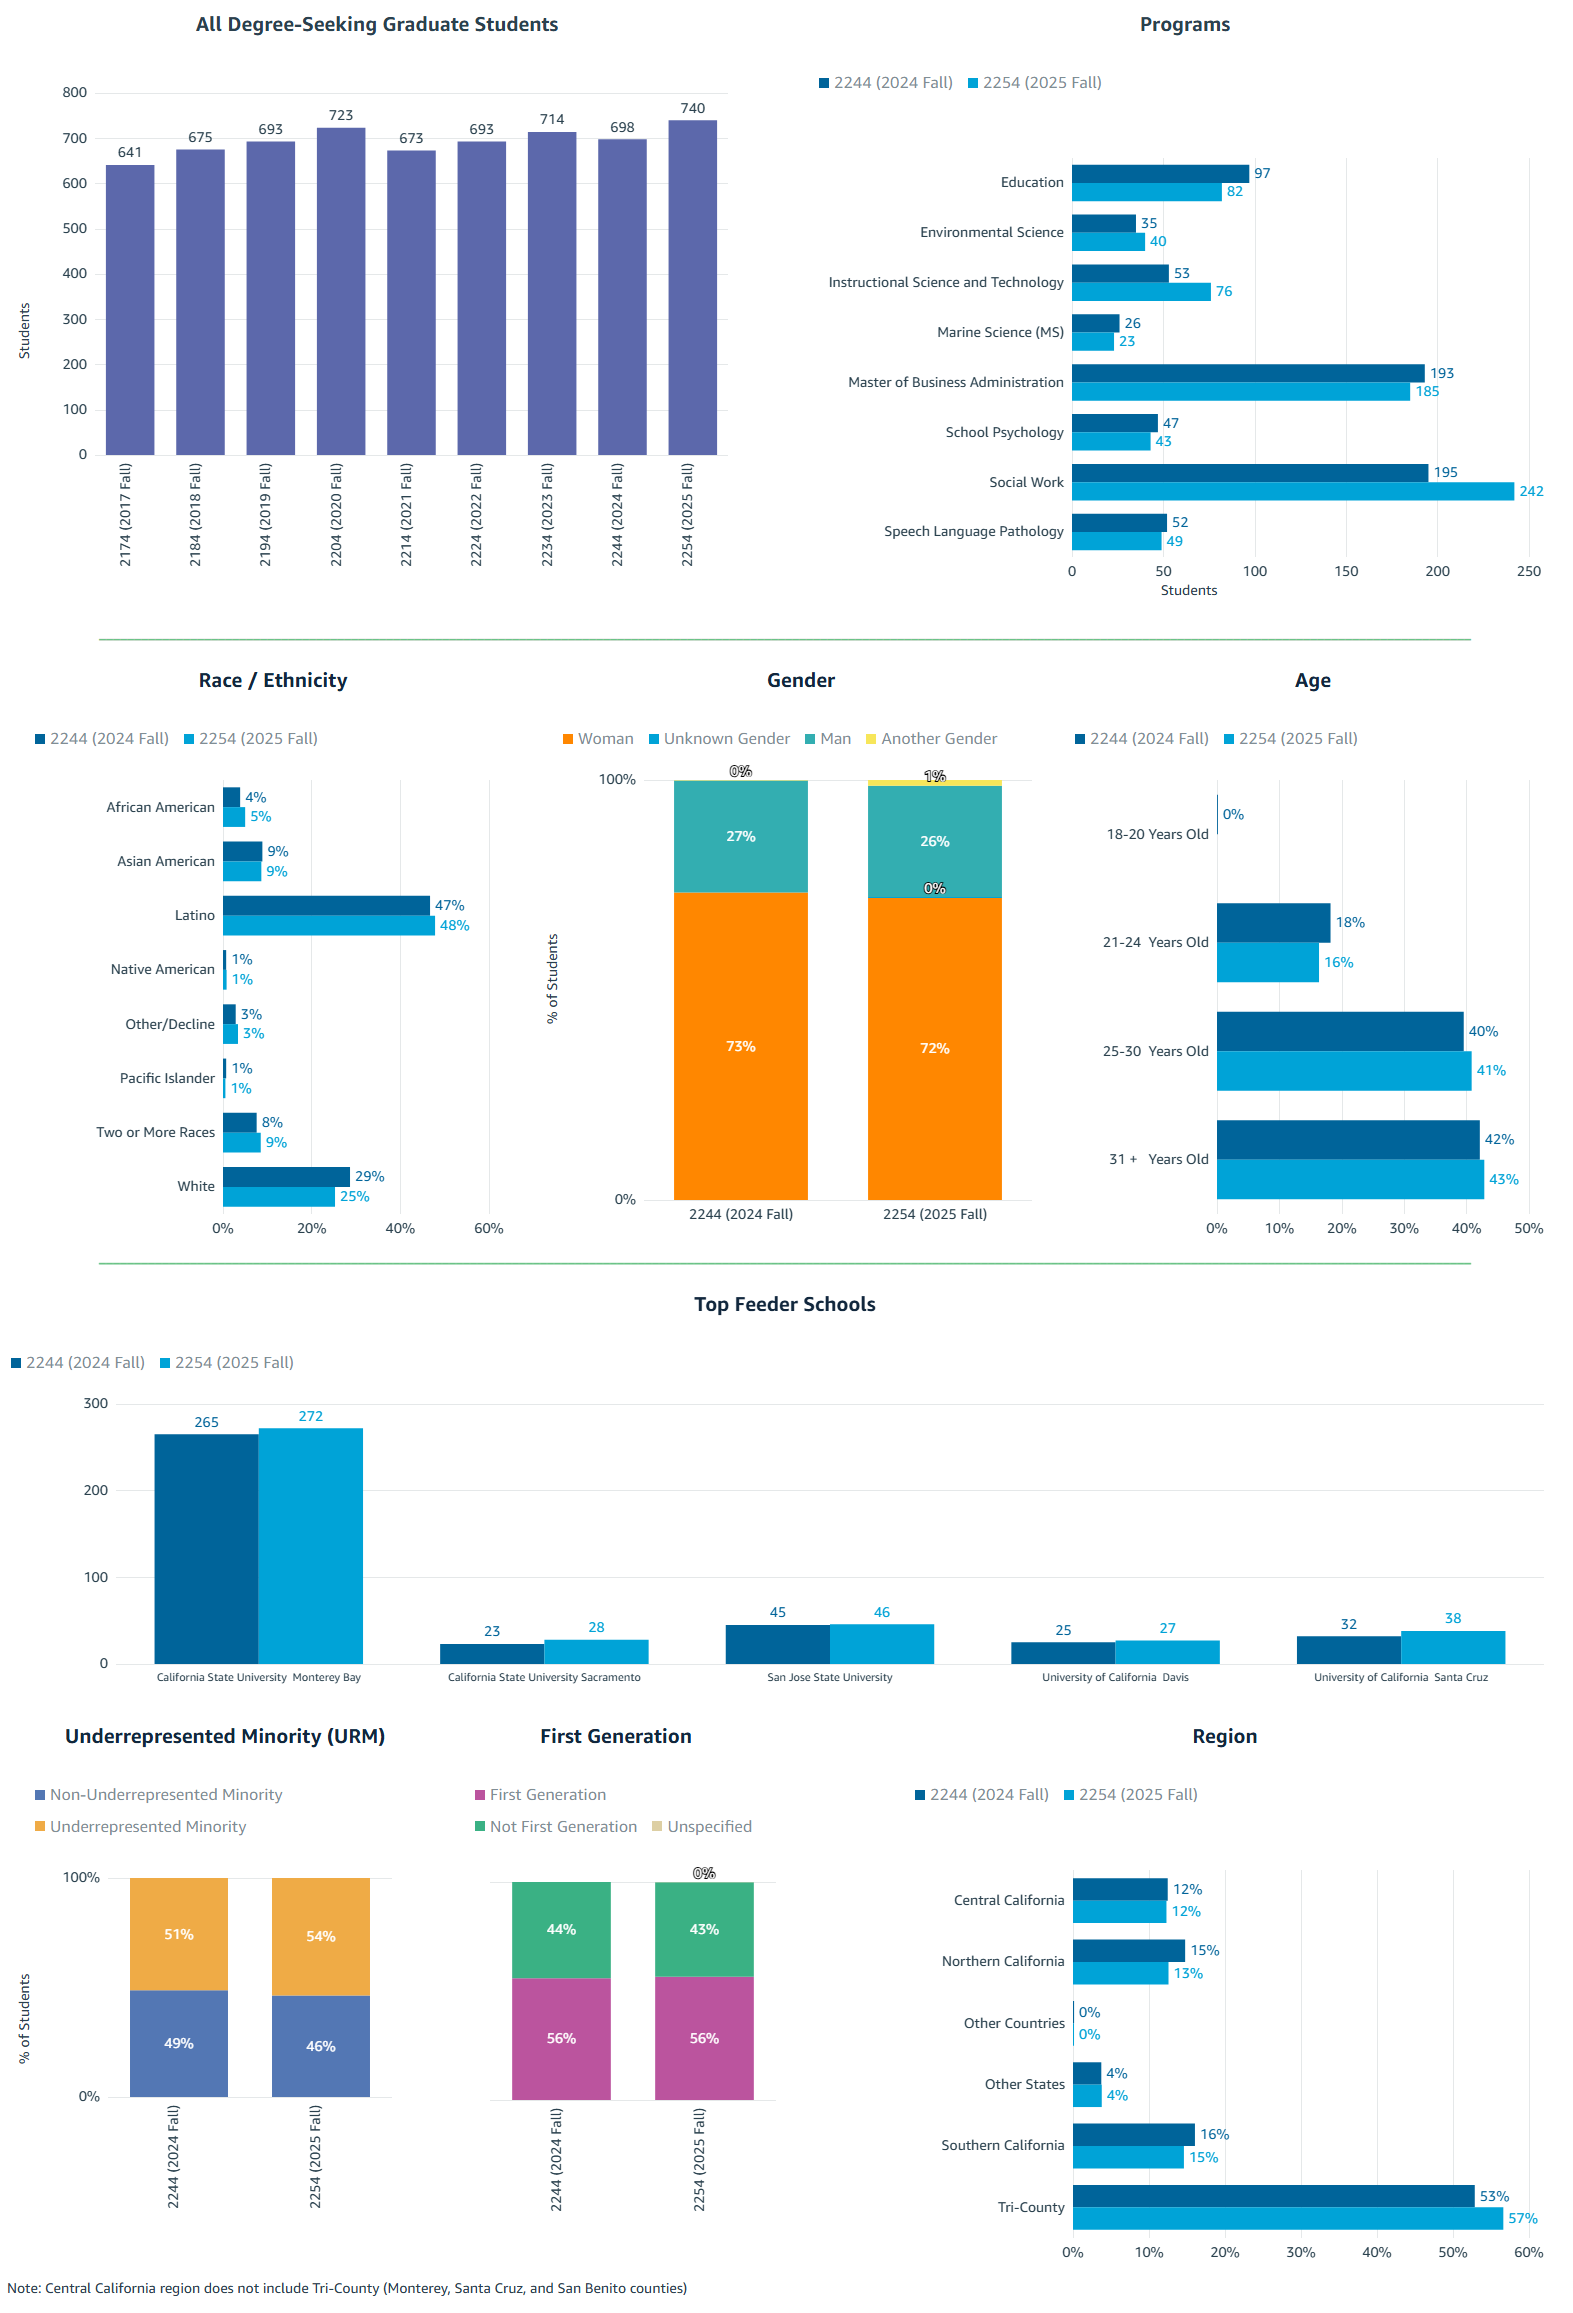
Term Students 2017 Fall 641 2018 Fall 675 2019 Fall 693 2020 Fall 723 2021 Fall 673 2022 Fall 693 2023 Fall 714 2024 Fall 698 2025 Fall 740 Programs
Programs 2024 Fall 2025 Fall Education 97 82 Environmental Science 35 40 Instructional Science and Technology 53 76 Marine Science (MS) 26 23 Master of Business Administration 193 185 School Psychology 47 43 Social Work 195 242 Speech Language Pathology 52 49 Race / Ethnicity
Race / Ethnicity 2024 Fall 2025 Fall African American 4% 5% Asian American 9% 9% Latino 47% 48% Native American 1% 1% Other / Decline 3% 3% Pacific Islander 1% 1% Two or More Races 8% 9% White 29% 25% Gender
Gender 2024 Fall 2025 Fall Woman 73% 72% Man 27% 26% Another Gender 0% 1% Unknown Gender 0% Age
Age 2024 Fall 2025 Fall 18 - 20 Years Old 0% 21 - 24 Years Old 18% 16% 25 - 30 Years Old 40% 41% 31 + Years Old 42% 43% Top Feeder Schools (Students Count)
School 2024 Fall 2025 Fall California State University, Monterey Bay 265 272 California State University, Sacramento 23 28 San Jose State University 45 46 University of California, Davis 25 27 University of California, Santa Cruz 32 38 Underrepresented Minority (URM)
Underrepresented Minority (URM) 2024 Fall 2025 Fall Non-URM 49% 46% URM 51% 54% First Generation
First Generation 2024 Fall 2025 Fall First Generation 56% 56% Not First Generation 44% 43% Unspecified 0% Region
Region 2024 Fall 2025 Fall Central California 12% 12% Northern California 15% 13% Other Countries 0% 0% Other States 4% 4% Southern California 16% 15% Tri-County 53% 57% Note: Central California region does not include Tri-County (Monterey, Santa Cruz, and San Benito counties)
Source: Campus Data Warehouse. Enrollment (Census) Overviews, Degree-Seeking Graduate Students.
All data are based on Census data extracted for the Chancellor's Office at State census.