Admissions Overview
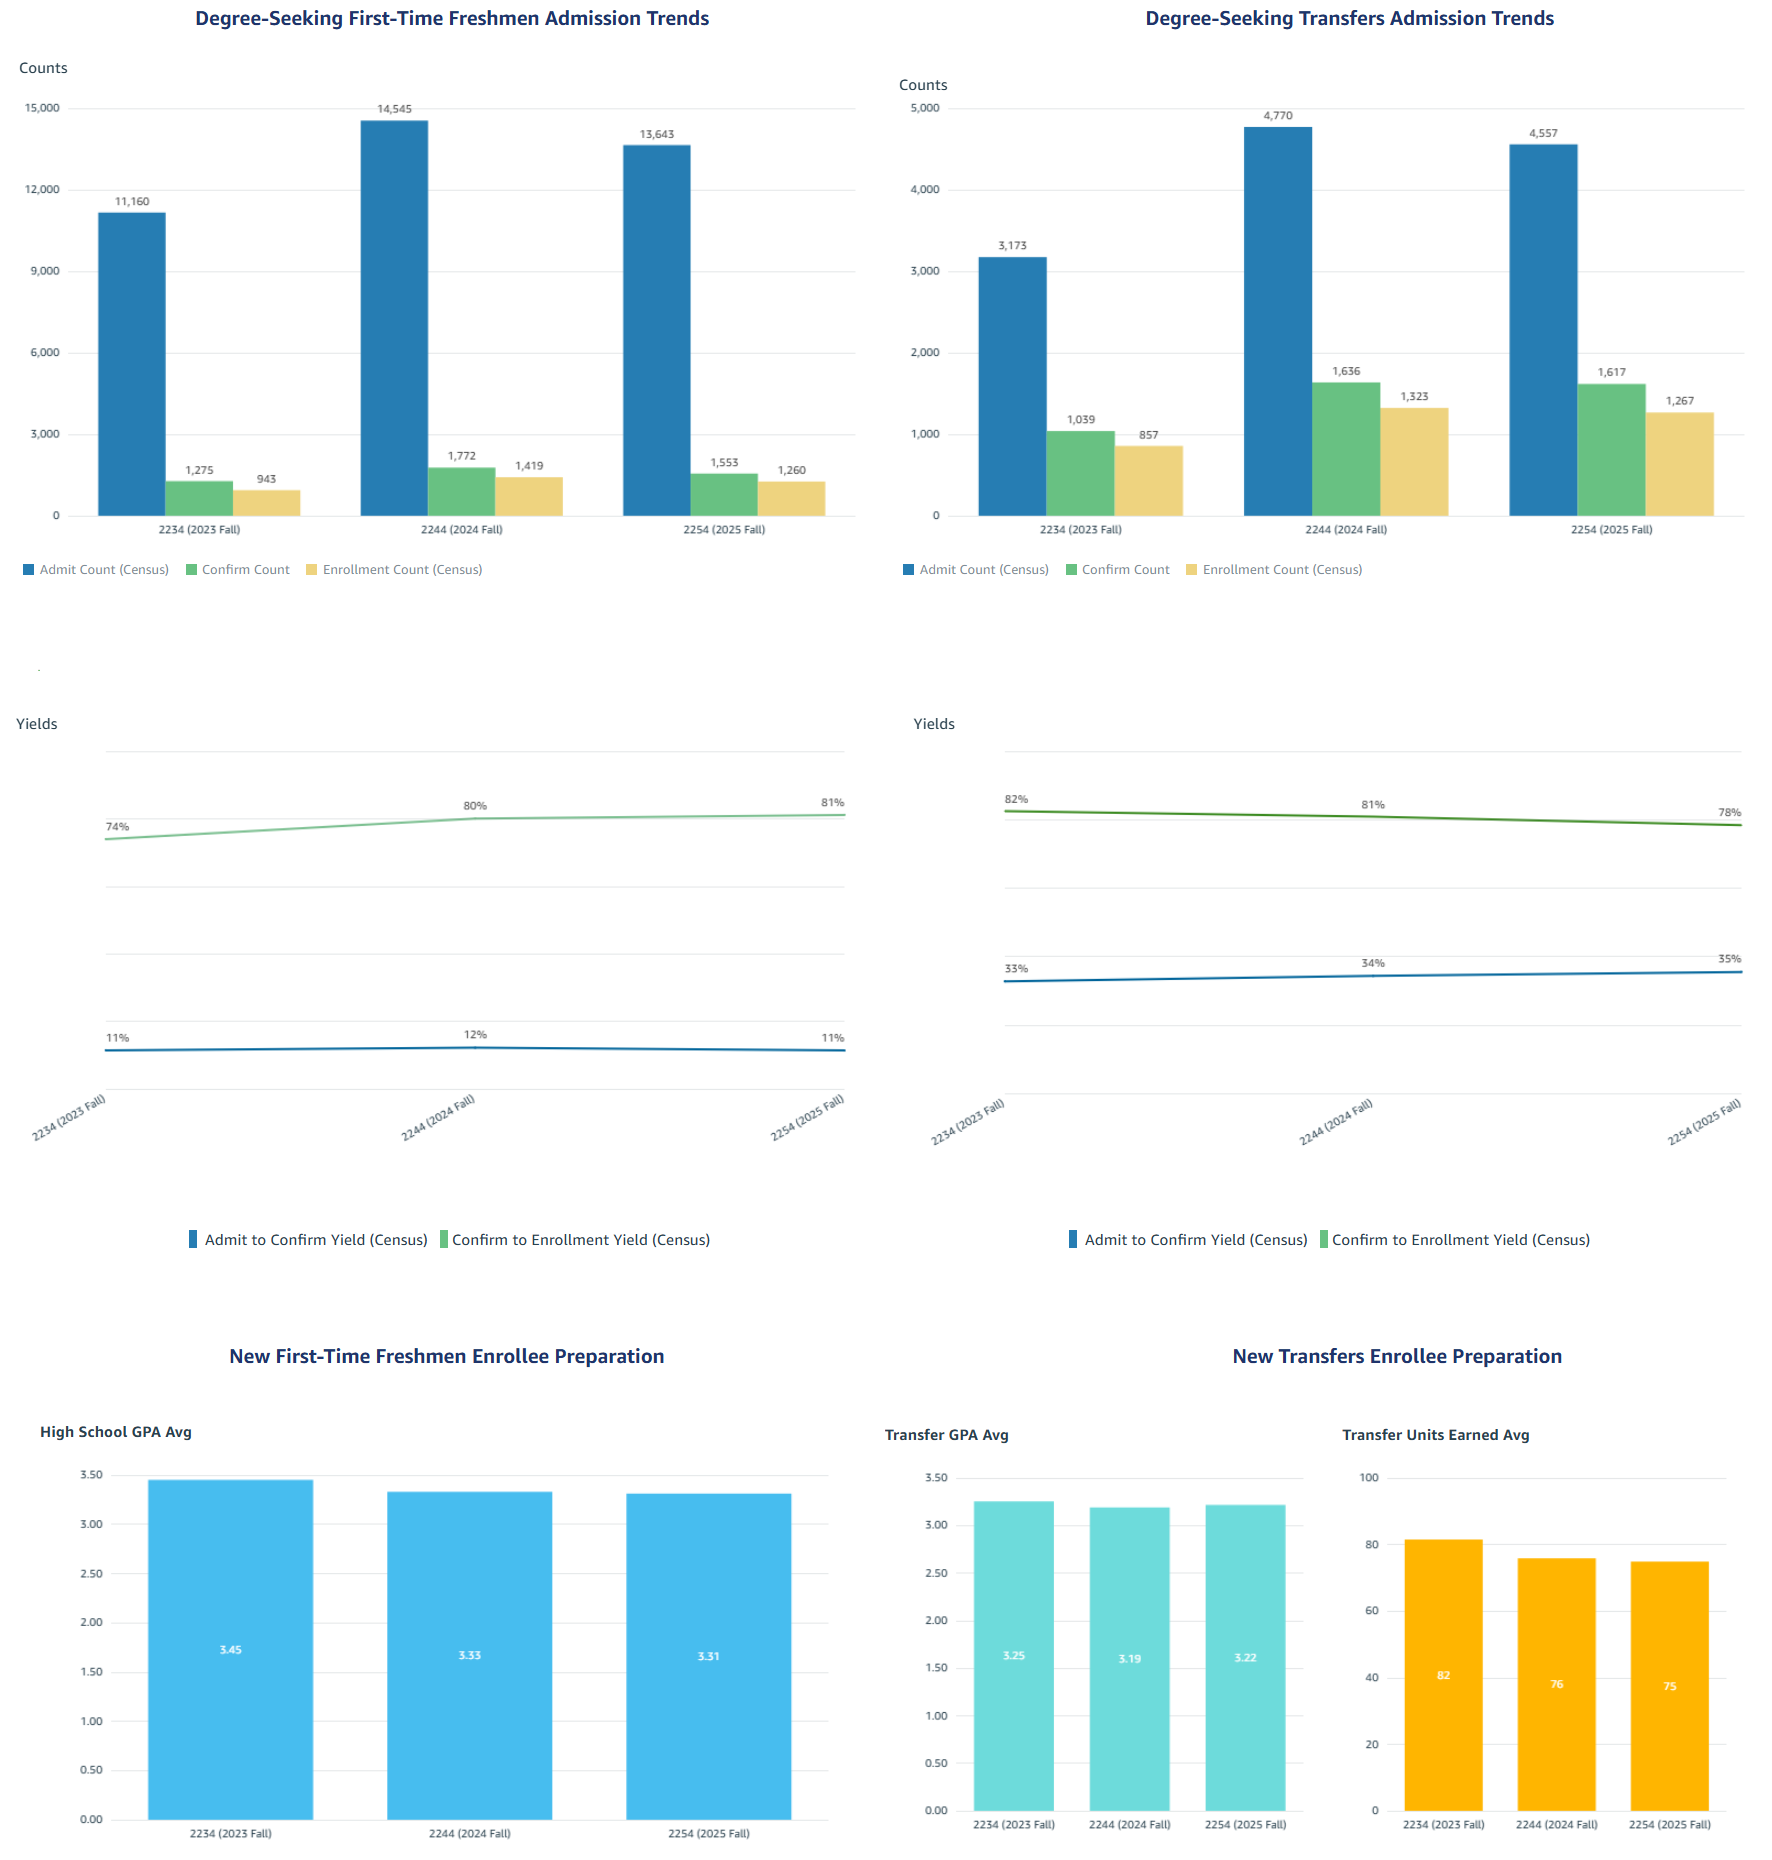
Degree-Seeking First-Time Freshmen Admission Trends
2023 Fall 2024 Fall 2025 Fall Admit Count (Census) 11,160 14,545 13,643 Admit to Confirm Yield (Census) 11% 12% 11% Confirm Count 1,275 1,772 1,553 Confirm to Enrollment Yield (Census) 74% 80% 81% Enrollment Count (Census) 943 1,419 1,260 New First-Time Freshmen Enrollee Preparation
Term High School GPA Avg 2023 Fall 3.45 2024 Fall 3.33 2025 Fall 3.31 Degree-Seeking Transfers Admission Trends
2023 Fall 2024 Fall 2025 Fall Admit Count (Census) 3,173 4,770 4,557 Admit to Confirm Yield (Census) 33% 34% 35% Confirm Count 1,039 1,636 1,617 Confirm to Enrollment Yield (Census) 82% 81% 78% Enrollment Count (Census) 857 1,323 1,267 New Transfers Enrollee Preparation
Term Transfer GPA Avg Transfer Units Earned Avg 2023 Fall 3.25 82 2024 Fall 3.19 76 2025 Fall 3.22 75
Source: Campus Data Warehouse. Admissions Funnel (Census) Overview.
All data are based on Census data extracted for the Chancellor's Office at State census.