Water
Water
Conserving water protects finite clean water sources, saves resources used in water treatment, and makes the campus more resilient in times of climate crisis or natural disaster. The campus responded well to the most recent drought, which lasted from 2011-2019, and exceeded all water reduction mandates, primarily by reducing irrigation. The goals in this section support lasting reductions.
Achievements
- Installed low-water plumbing fixtures used to reduce building water use throughout campus.
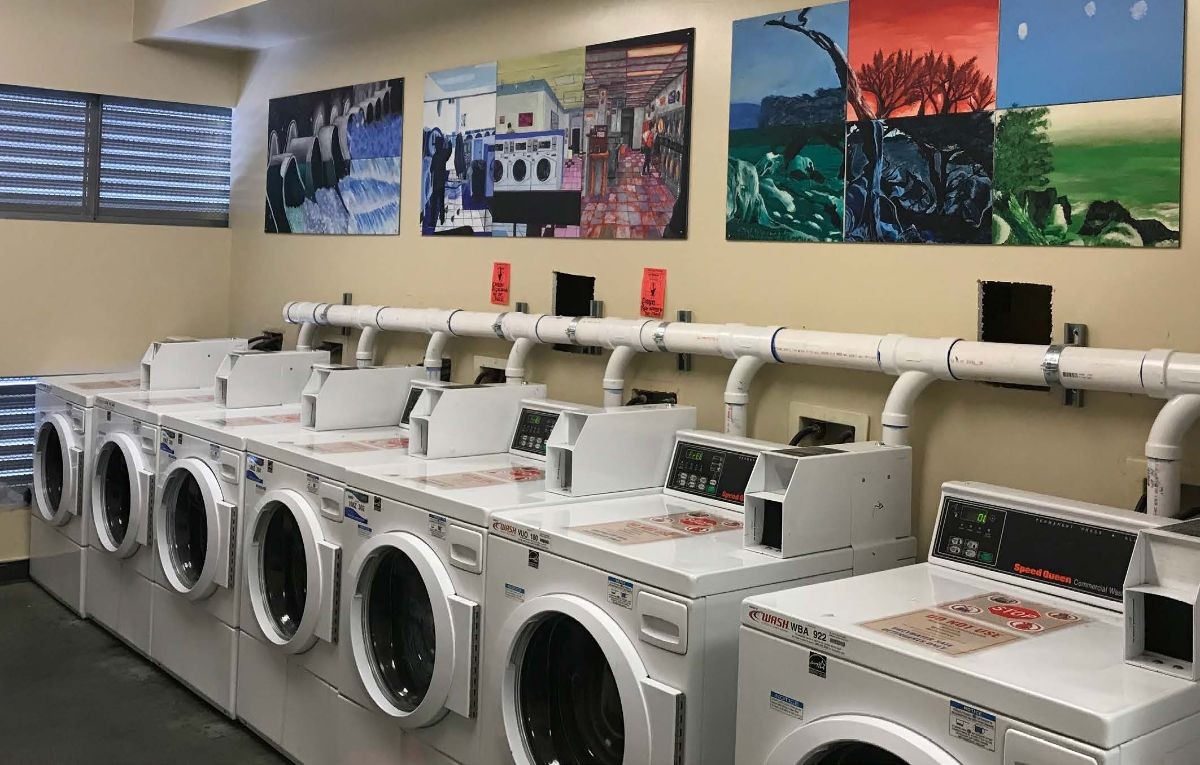
- Laundry to Landscape model system installed in Pinnacles Residential Hall, collecting, filtering and irrigating adjacent landscaping with water from 8 washing machines.
- 26% decrease in potable water use since 2011.
CSU Sustainability Policy Goals:
Governor Jerry Brown's announcement to reduce water use across the state of California, due to the current drought, prompted a series of actions by CSUMB.
- Reduce 10% by 2016.
- reduce 20% by 2020.
- Use recycled/reclaim water where possible.
The 2013 Climate Action Plan established recommended “Action Steps” for each topic area. Below are the action steps for water:
WAT1. All new fixtures will be water-saving for new or refurbished buildings, or replacement/repair.Consider: -Short-burst automatic sinks and/or aerators. -Dual-flush toilets and/or waterless urinals. -Low-flow sunflower-type rain showerheads. WAT2. Review draft landscaping and irrigation plan for sustainability: -Include lawn and athletic fields, consider more synthetic turf. -Xeriscaping with native plants, minimize irrigated landscaping. -Facilitate groundwater infiltration. -Retain native vegetation where possible. -Minimize or eliminate toxic pesticides, fertilizers, and other chemicals.
WAT3. Review drinking water/bottled water systems on campus. -Provide good convenient alternatives to small bottled water sales. -Explore tap water filtration systems in lieu of large bottled water systems, such as Glacier dispensers or Brita filters. -Bring-your-own mugs/glasses campaign. WAT4. Establish an outdoor water use policy for car-washing, power-washing, etc., to avoid water waste. WAT5. Augment on-site water sources -Consider rainwater capture and storage for irrigation. -Re-visit and explore barriers to using existing recycled water pipe infrastructure as planned (purple pipe). Consider new partnerships. -Reduce impervious surface ground coverage on campus with permeable materials and structures.
- Use non-potable water supply for all non-potable water demands in any new improvement on campus and feasible retrofit.
- Explore opportunities to meet Net Positive Water for campus.
- Remain an active partner in discussions and agreements regarding regional, potable, and reclaimed water supply.
- Explore partnerships and opportunities to show the natural cycle of water and our connection to it.
- Eliminate the use of water delivery services on campus. Install hydration stations in all buildings and key outdoor areas.
- Increase native and/or drought-tolerant landscape.
- Eliminate the use of potable water on landscape.
- Use non-potable water supply for all non-potable water demands in any new improvement on campus.
- Reduce potable water use to levels below CalGreen standards in all new construction projects.
- Percolate all stormwater within the campus boundary.
- Implement stormwater design guidelines and Low Impact Development for all new building construction and major renovation while enhancing landscape and beautification.
- Identify the percent of campus water fixtures that meet the highest standard of water conservation and upgrade 10% of fixtures below this standard every year to reach 100% water efficient fixtures.


Contacts
